
Case Study #2: Customer Lifetime Value Analysis (CLTV) using Python
Customer Lifetime Value (CLTV) is another term for “Customer Lifetime Revenue (CLTR).” It is largely used in the business marketing domain. CLTV is the amount that the customer is expected to spend on the business throughout the course of the relationship.
Customer Lifetime Value Analysis is therefore used to evaluate the overall value of customers over the course of their relationship with the business. It helps businesses improve their customer relationships through data-driven marketing techniques.So, if you want to understand more about CLTV analysis, you’ve come to the perfect place. In this story, I will walk you through the complete CLTV analysis procedure that you must follow.
· Overview: · Customer Lifetime Value Analysis using Python: ∘ Data Preparation: ∘ Grouping Data by Channels: ∘ Calculating Customer Lifetime Value(CLVI): · Conclusion · My Viral Articles
Overview:
Customer Lifetime Value Analysis is a method of estimating the value that a customer will generate for the business over the course of their whole relationship.
With CLTV Analysis, we can identify the most important customers to prioritize, and it also helps the business decide how much to invest in “Customer Acquisition,” “Retention Efforts,” and “Marketing Campaigns.” It also assists the business in determining the most successful marketing channels and strategies for acquiring high-value consumers.
So, in order to complete such a task, we require a dataset that contains data based on the Customer’s relationship with the business, such as “CustomerID”, “Channels”, “Conversion Rate”, “Revenue”, and so on. This dataset is being used in this story: Dataset Link
Customer Lifetime Value Analysis using Python:
Data Preparation:
First, we need to start by importing the necessary libraries for the problem and loading the dataset to be used:
import pandas as pd
import numpy as np
import matplotlib.pyplot as plt
import seaborn as sns
df = pd.read_csv('customer_acquisition_data.csv')
df.head()The data looks like:
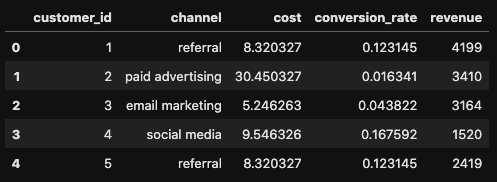
After loading the dataset, we should perform some data preprocessing steps like identifying missing values, outliers, etc.
# Methods like the following operations:

df.shape
df.isnull().sum()
df.info()
df.describe()
Now, before getting into customer segmentation and value analysis, let’s look at the distribution of Acquisition cost and Revenue in the data:
#Visualization of Distribution of Acquisition Cost in the data:

plt.figure(figsize=(10,6))

sns.histplot(data = df,
             x = df['cost'],
             bins = 20,
             kde= True
             )
plt.title('Distribution of Acquisition Cost')
plt.show()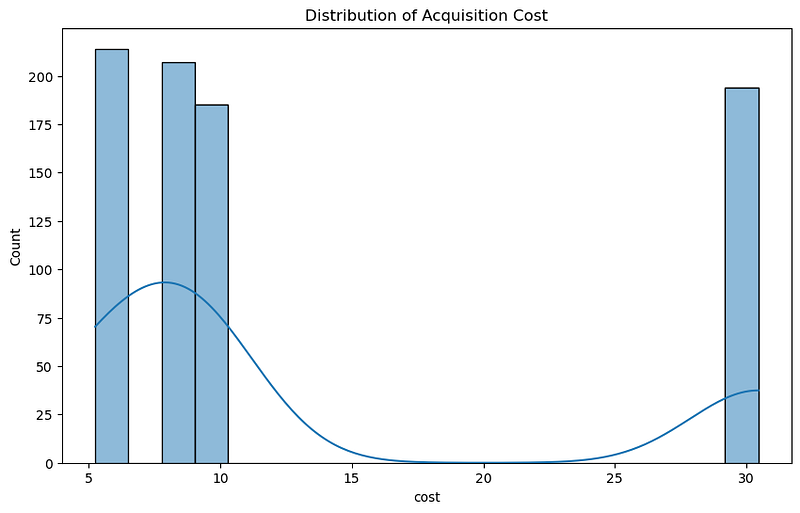
#Visualizing the distribution of Revenue in the data:

plt.figure(figsize=(10,6))

sns.histplot(data = df,
             x = df['revenue'],
             bins = 20,
             kde= True)
plt.title('Distribution of Revenue Amount')
plt.show()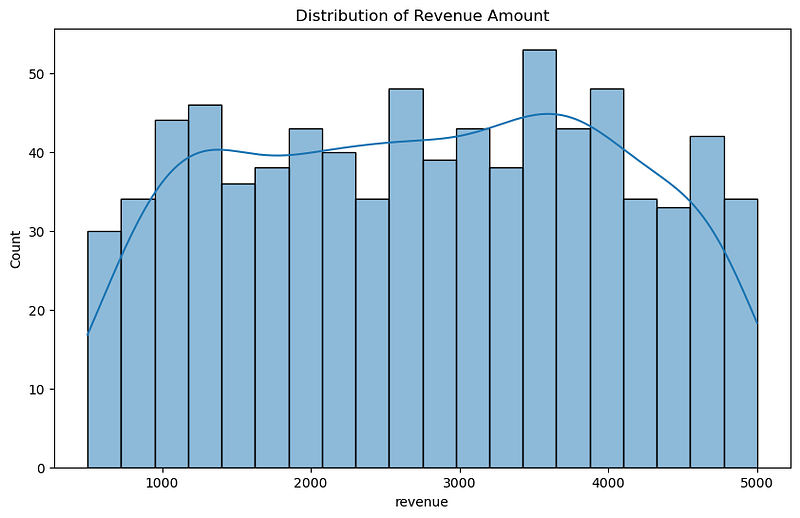
Grouping Data by Channels:
Let’s analyze the Acquisition cost of the customers based on different channels:
channel_cost = df.groupby('channel')['cost'].mean().reset_index()plt.figure(figsize=(10,6))
sns.barplot(data = channel_cost,
x = 'channel',
y = 'cost')
plt.title('Customer Acquisition Cost by Channel')
plt.show()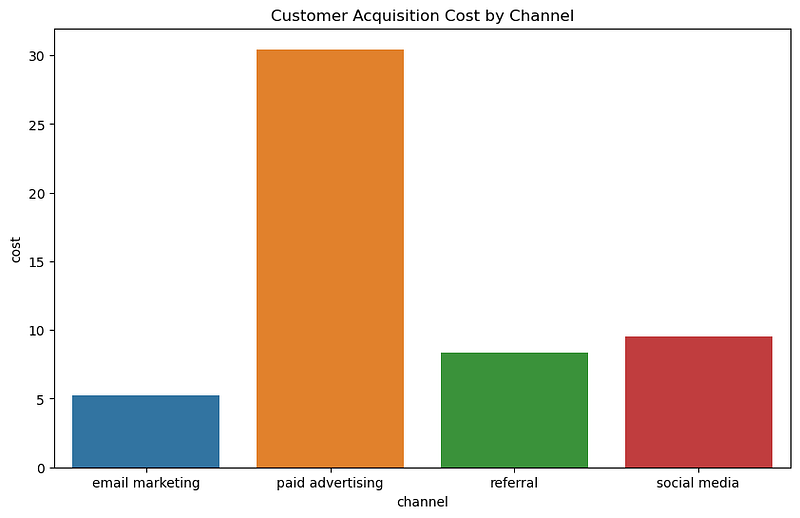
We can observe that the “Paid Advertising” channel has the highest cost here. So, if the consumers acquired through this channel have a high customer conversion rate and revenue, it is worth considering; otherwise, we must optimize our acquisition cost plan. In addition, among the channels, email marketing has the lowest acquisition cost. So, after weighing the expenses of the various channels, it is the best alternative. Finally, compared to paid advertising, referral and social media are much less expensive. As a result, it is advantageous in terms of cost acquisition.
So, let’s see which channel has the best conversion rate:
channel_conversion_rate = df.groupby('channel')['conversion_rate'].mean().reset_index()plt.figure(figsize=(10,6))
sns.barplot(data = channel_conversion_rate,
x = 'channel',
y = 'conversion_rate')
plt.title('Customer Conversion Rate by Channel')
plt.show()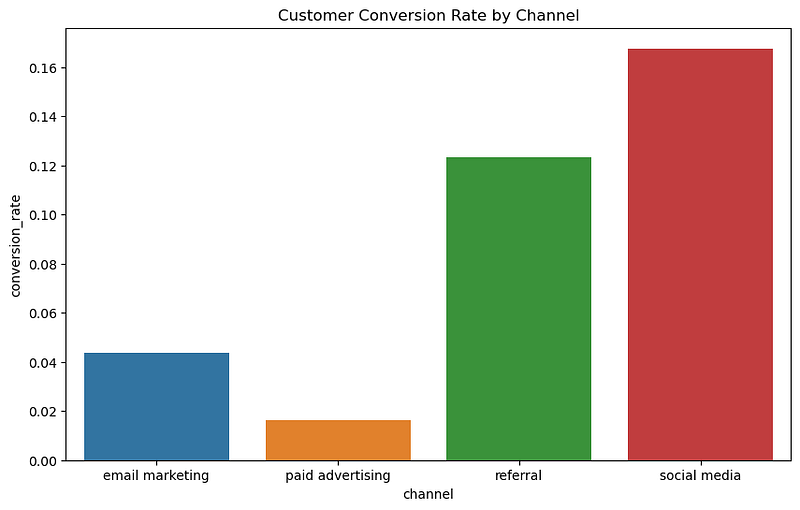
In this bar graph, we can clearly see that the conversion rate of consumers from social media and referral has the highest spot, while paid advertising is struggling with the lowest conversion rate. And email marketing is doing alright. As a result, we realized which channel we should prioritize in order to bring customers to the business.
Now, let’s study the revenue generated for the business by different channels:
channel_revenue = df.groupby('channel')['revenue'].sum().reset_index()values = channel_revenue['revenue']
labels = channel_revenue['channel']
colors = ['lightcoral', 'lightskyblue', 'lightgreen', 'lightpink']
plt.figure(figsize=(8,8))
plt.pie(values, labels= labels, autopct= '%1.1f%%', startangle= 90,
colors= colors, wedgeprops= dict(width = 0.4))
plt.title('Total Revenue by Channel')
plt.axis('equal')
plt.show()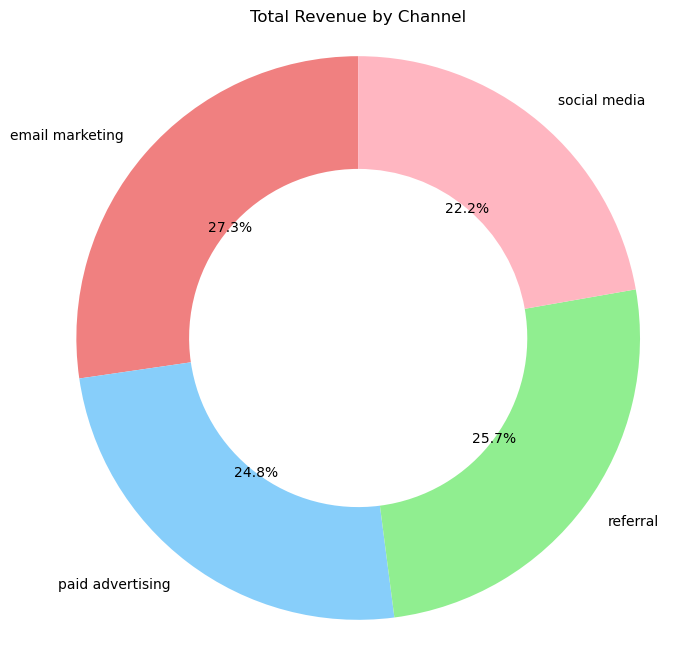
According to this pie graph, each channel makes almost the same amount of revenue. As a result, we cannot determine which channel is less profitable. However, it appears that email marketing is the most profitable channel, slightly more so than the others.
Finally, before calculating the Customer Lifetime Value, let’s analyze the ROI of each channel. It will assist in the development of strategies for increasing revenues or profits and customer retention.
#Calculating ROI(Return on Investment)
df['roi'] = (df['revenue'] - df['cost']) / df['cost']

channel_roi = df.groupby('channel')['roi'].mean().reset_index()plt.figure(figsize=(10,6))
sns.barplot(data = channel_roi,
x = 'channel',
y = 'roi')
plt.title('Return on Investment(ROI) by Channel')
plt.show()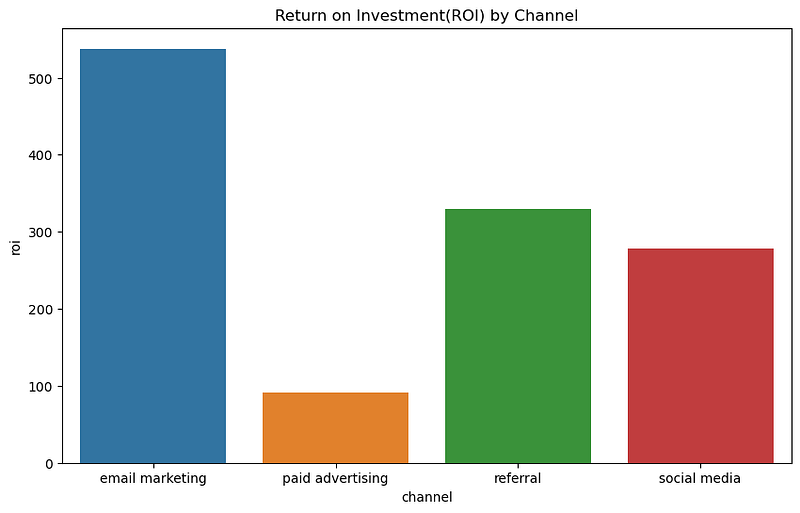
Here, the ROI of email marketing seems promising, but paid advertising, despite its high cost, struggles to show a solid ROI.
In this way, we have to collect insights of each channels before calculating the “CLTV”. Finally, Let’s start calculating “CLTV”:
Calculating Customer Lifetime Value(CLVI):
In this task, the formula for CLVI is:
CLVI = (revenue — cost) * conversion_rate/ cost
#Calculating CLVI(Customer Lifetime Value)
df['cltv'] = (df['revenue'] - df['cost']) * df['conversion_rate'] / df['cost']

channel_cltv = df.groupby('channel')['cltv'].mean().reset_index()plt.figure(figsize=(10,6))
sns.barplot(data = channel_cltv,
x = 'channel',
y = 'cltv')
plt.title('Customer Lifetime Value (CLTV) by Channel')
plt.show()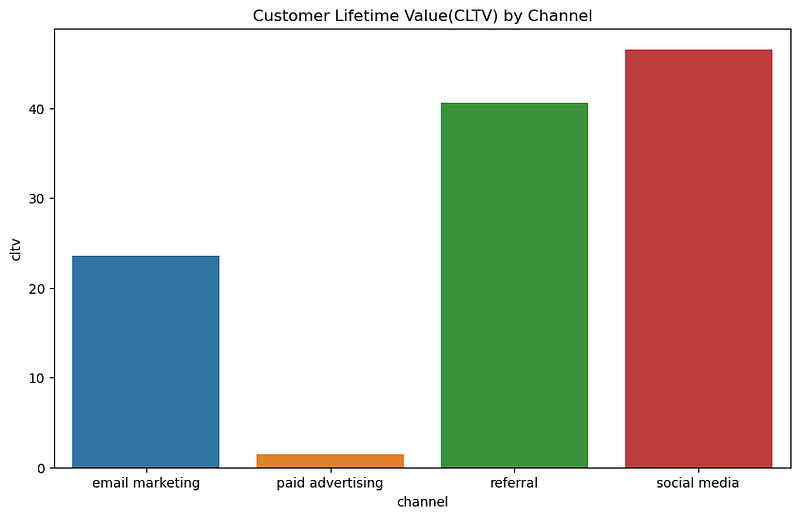
Finally, customer lifetime value via social media and referral is the greatest, and paid advertising struggles here as well. So, after analysing all of the information, we may build the tactics for the business in this manner.
Lastly, let’s compare the CLTV distributions of social media and referral channels:
subset = df.loc[df['channel'].isin(['social media', 'referral'])]

plt.figure(figsize=(10,6))
sns.boxplot(data = subset,
            x = 'channel',
            y = 'cltv'
            )

plt.title('CLTV Distribution by Channel')
plt.xlabel('Channel')
plt.ylabel('CLTV')

plt.show()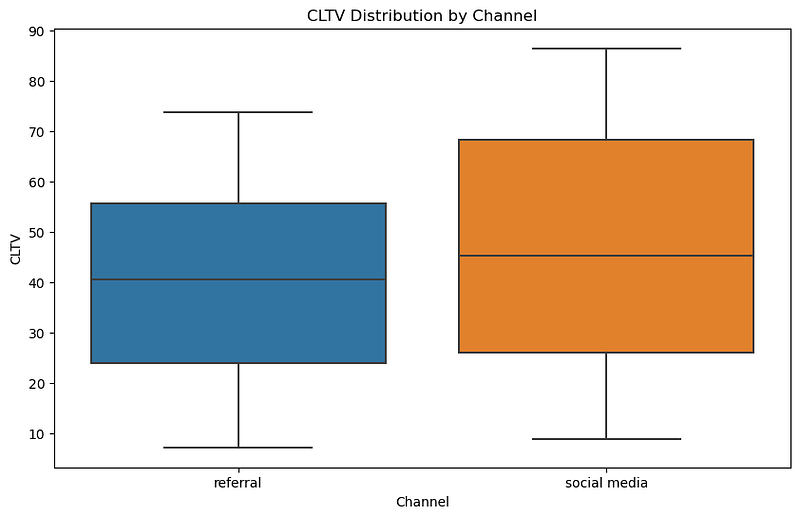
Conclusion
In conclusion, Customer Lifetime Value (CLV) is the compass that directs businesses towards long-term success. It quantifies the value of client connections, allowing businesses to better manage resources, customize marketing tactics, and maximize profits. Python is used to unlock CLV’s potential by enabling data-driven choices and forecasts. Businesses may succeed in an era where customer-centric strategies are crucial by leveraging the insights obtained by CLV research, assuring sustainable growth and a brighter future.
- ⭐️ Click here, You can also buy me a coffee if you like this story. It will be a great help to me. Thank You!
For more case study data science projects: https://github.com/richardwarepam16
Also read: https://readmedium.com/rfm-analysis-using-python-5df29f3cf757 (RFM Analysis using Python)


