avatarAlexzap

Summary

The article presents an algorithmic trading strategy using Williams %R and MACD indicators to trade NVIDIA stocks, with a Python implementation and backtesting results that outperform the SPY benchmark.

Abstract

The article delves into an algorithmic trading strategy that leverages the Williams %R and Moving Average Convergence Divergence (MACD) technical indicators to trade NVIDIA (NVDA) stocks. It provides a step-by-step guide on how to implement this strategy in Python, including data retrieval, indicator calculation, and visualization. The strategy involves buying when the MACD line crosses above the signal line and selling when it crosses below. The article also includes a backtesting analysis, demonstrating that a $10,000 investment in NVDA using this strategy from January 2021 to March 2024 would have yielded a 50% profit, outperforming the SPY benchmark by 22%. The author emphasizes the bullish trend and momentum indicators for NVDA and acknowledges the importance of considering technical analysis alongside fundamentals.

Opinions

  • The author believes that the combination of Williams %R and MACD provides a robust technical signal for trading NVDA stocks.
  • There is a positive outlook on NVDA's stock performance based on the technical analysis presented.
  • The article suggests that algorithmic trading strategies can offer significant profits, as evidenced by the backtested results.
  • The author implies that the WR-MACD strategy is superior to the SPY benchmark, indicating a potentially more profitable investment approach for traders.
  • A disclaimer is provided, noting that technical analysis does not take into account fundamental aspects of the stock, which could be a limitation of the strategy.
  • The author encourages readers to explore AI-powered trading tools, recommending a cost-effective AI service as an alternative to ChatGPT Plus(GPT-4).

Algo-Trading NVIDIA with Williams %R & MACD Indicators

Image Design Template via Canva
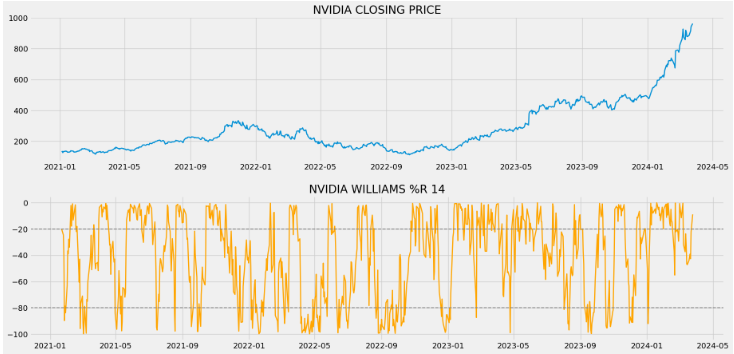
  • The focus of this article is still on the NVIDIA stock to ensure the most efficient execution of an algo-trading strategy by examining the Williams %R &MACD technical indicators.
  • Williams %R moves between zero and -100. A reading above -20 is overbought. A reading below -80 is oversold.
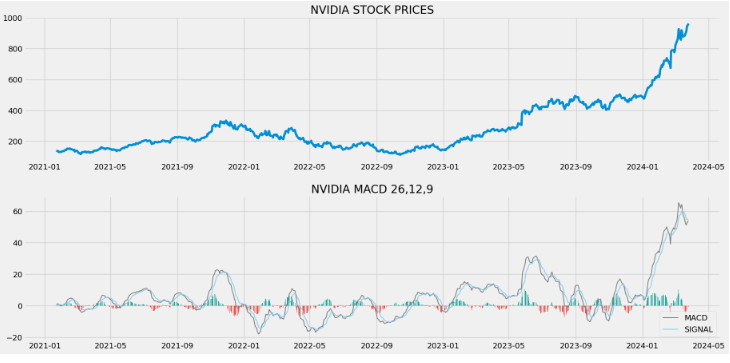
  • When the MACD line crosses from below to above the signal line, the indicator is considered bullish (accompanied by positive histogram bars, indicating upward momentum). The further below the zero line the stronger the signal. When the MACD line crosses from above to below the signal line, the indicator is considered bearish (accompanied by negative histogram bars, suggesting downward momentum). The further above the zero line the stronger the signal.
  • Let’s delve into the specifics of the algo-trading workflow in Python:
  • Creating the working directory YOURPATH and importing libraries
import os
os.chdir('C:/Users/adrou/OneDrive/Documents/STOCKNIKHIL')    # Create working directory
os. getcwd()

import pandas as pd
import numpy as np
import requests
import matplotlib.pyplot as plt
from math import floor
from termcolor import colored as cl

plt.style.use('fivethirtyeight')
plt.rcParams['figure.figsize'] = (20,10)
  • Getting NVIDIA historical stock data during 01/2021–03/2024
def get_historical_data(symbol, start_date):
    api_key = 'a07d718849d64be78e8a7d5669e4e3af'
    api_url = f'https://api.twelvedata.com/time_series?symbol={symbol}&interval=1day&outputsize=5000&apikey={api_key}'
    raw_df = requests.get(api_url).json()
    df = pd.DataFrame(raw_df['values']).iloc[::-1].set_index('datetime').astype(float)
    df = df[df.index >= start_date]
    df.index = pd.to_datetime(df.index)
    return df

aapl = get_historical_data('NVDA', '2021-01-01')
aapl.tail()

            open      high      low       close     volume
datetime     
2024-03-19 867.00000 905.44000 850.09998 893.97998 67217100.0
2024-03-20 897.96997 904.09998 882.22998 903.71997 47906300.0
2024-03-21 923.00000 926.47998 904.04999 914.34998 48037200.0
2024-03-22 911.40997 947.78003 908.34003 942.89001 58521500.0
2024-03-25 940.00000 967.65991 935.09998 962.25403 40951376.0
# WILLIAMS %R CALCULATION

def get_wr(high, low, close, lookback):
    highh = high.rolling(lookback).max() 
    lowl = low.rolling(lookback).min()
    wr = -100 * ((highh - close) / (highh - lowl))
    return wr

aapl['wr_14'] = get_wr(aapl['high'], aapl['low'], aapl['close'], 14)
aapl.tail()

# WILLIAMS %R PLOT

plot_data = aapl[aapl.index >= '2021-01-01']

ax1 = plt.subplot2grid((11,1), (0,0), rowspan = 5, colspan = 1)
ax2 = plt.subplot2grid((11,1), (6,0), rowspan = 5, colspan = 1)
ax1.plot(plot_data['close'], linewidth = 2)
ax1.set_title('NVIDIA CLOSING PRICE')
ax2.plot(plot_data['wr_14'], color = 'orange', linewidth = 2)
ax2.axhline(-20, linewidth = 1.5, linestyle = '--', color = 'grey')
ax2.axhline(-80, linewidth = 1.5, linestyle = '--', color = 'grey')
ax2.set_title('NVIDIA WILLIAMS %R 14')
plt.show()
NVIDIA closing price vs the Williams %R 14 indicator
  • Calculating and plotting the MACD indicator
# MACD CALCULATION

def get_macd(price, slow, fast, smooth):
    exp1 = price.ewm(span = fast, adjust = False).mean()
    exp2 = price.ewm(span = slow, adjust = False).mean()
    macd = pd.DataFrame(exp1 - exp2).rename(columns = {'close':'macd'})
    signal = pd.DataFrame(macd.ewm(span = smooth, adjust = False).mean()).rename(columns = {'macd':'signal'})
    hist = pd.DataFrame(macd['macd'] - signal['signal']).rename(columns = {0:'hist'})
    return macd, signal, hist

aapl['macd'] = get_macd(aapl['close'], 26, 12, 9)[0]
aapl['macd_signal'] = get_macd(aapl['close'], 26, 12, 9)[1]
aapl['macd_hist'] = get_macd(aapl['close'], 26, 12, 9)[2]
aapl = aapl.dropna()
aapl.tail()

# MACD PLOT

plot_data = aapl[aapl.index >= '2021-01-01']

def plot_macd(prices, macd, signal, hist):
    ax1 = plt.subplot2grid((11,1), (0,0), rowspan = 5, colspan = 1)
    ax2 = plt.subplot2grid((11,1), (6,0), rowspan = 5, colspan = 1)

    ax1.plot(prices)
    ax1.set_title('NVIDIA STOCK PRICES')
    ax2.plot(macd, color = 'grey', linewidth = 1.5, label = 'MACD')
    ax2.plot(signal, color = 'skyblue', linewidth = 1.5, label = 'SIGNAL')
    ax2.set_title('NVIDIA MACD 26,12,9')

    for i in range(len(prices)):
        if str(hist[i])[0] == '-':
            ax2.bar(prices.index[i], hist[i], color = '#ef5350')
        else:
            ax2.bar(prices.index[i], hist[i], color = '#26a69a')

    plt.legend(loc = 'lower right')

plot_macd(plot_data['close'], plot_data['macd'], plot_data['macd_signal'], plot_data['macd_hist'])
NVIDIA closing price vs the MACD indicator
  • Calculating the Williams %RMACD (WR-MACD) trading strategy, position, daily returns, and cumulative returns
# TRADING STRATEGY

def implement_wr_macd_strategy(prices, wr, macd, macd_signal):    
    buy_price = []
    sell_price = []
    wr_macd_signal = []
    signal = 0

    for i in range(len(wr)):
        if macd[i] > macd_signal[i]:
            if signal != 1:
                buy_price.append(prices[i])
                sell_price.append(np.nan)
                signal = 1
                wr_macd_signal.append(signal)
            else:
                buy_price.append(np.nan)
                sell_price.append(np.nan)
                wr_macd_signal.append(0)
                
        elif macd[i] < macd_signal[i]:
            if signal != -1:
                buy_price.append(np.nan)
                sell_price.append(prices[i])
                signal = -1
                wr_macd_signal.append(signal)
            else:
                buy_price.append(np.nan)
                sell_price.append(np.nan)
                wr_macd_signal.append(0)
        
        else:
            buy_price.append(np.nan)
            sell_price.append(np.nan)
            wr_macd_signal.append(0)
            
    return buy_price, sell_price, wr_macd_signal
            
buy_price, sell_price, wr_macd_signal = implement_wr_macd_strategy(aapl['close'], aapl['wr_14'], aapl['macd'], aapl['macd_signal'])

# POSITION

position = []
for i in range(len(wr_macd_signal)):
    if wr_macd_signal[i] > 1:
        position.append(0)
    else:
        position.append(1)
        
for i in range(len(aapl['close'])):
    if wr_macd_signal[i] == 1:
        position[i] = 1
    elif wr_macd_signal[i] == -1:
        position[i] = 0
    else:
        position[i] = position[i-1]
        
close_price = aapl['close']
wr = aapl['wr_14']
macd_line = aapl['macd']
signal_line = aapl['macd_signal']
wr_macd_signal = pd.DataFrame(wr_macd_signal).rename(columns = {0:'wr_macd_signal'}).set_index(aapl.index)
position = pd.DataFrame(position).rename(columns = {0:'wr_macd_position'}).set_index(aapl.index)

frames = [close_price, wr, macd_line, signal_line, wr_macd_signal, position]
strategy = pd.concat(frames, join = 'inner', axis = 1)

strategy.head()

rets = aapl.close.pct_change().dropna()
strat_rets = strategy.wr_macd_position[1:]*rets

plt.title('NVIDIA Daily Returns')
rets.plot(color = 'blue', alpha = 0.3, linewidth = 7)
strat_rets.plot(color = 'r', linewidth = 1)
plt.show()
rets_cum = (1 + rets).cumprod() - 1 
strat_cum = (1 + strat_rets).cumprod() - 1

plt.title('Cumulative Returns')
rets_cum.plot(color = 'blue', alpha = 0.3, linewidth = 7)
strat_cum.plot(color = 'r', linewidth = 2)
plt.show()
NVIDIA Daily Returns
NVIDIA Cumulative Returns
  • Backtesting: calculating the profit gained from the WR-MACD strategy by investing $10k in NVDA
aapl_ret = pd.DataFrame(np.diff(aapl['close'])).rename(columns = {0:'returns'})
adx_strategy_ret = []

for i in range(len(aapl_ret)):
    returns = aapl_ret['returns'][i]*strategy['wr_macd_position'][i]
    adx_strategy_ret.append(returns)
    
adx_strategy_ret_df = pd.DataFrame(adx_strategy_ret).rename(columns = {0:'returns'})
investment_value = 10000
number_of_stocks = floor(investment_value/aapl['close'][-1])
adx_investment_ret = []

for i in range(len(adx_strategy_ret_df['returns'])):
    returns = number_of_stocks*adx_strategy_ret_df['returns'][i]
    adx_investment_ret.append(returns)

adx_investment_ret_df = pd.DataFrame(adx_investment_ret).rename(columns = {0:'investment_returns'})
total_investment_ret = round(sum(adx_investment_ret_df['investment_returns']), 2)
profit_percentage = floor((total_investment_ret/investment_value)*100)
print(cl('Profit gained from the WR-MACD strategy by investing $10k in NVDA: {}'.format(total_investment_ret), attrs = ['bold']))
print(cl('Profit percentage of the WR-MACD strategy : {}%'.format(profit_percentage), attrs = ['bold']))
  • Output:
Profit gained from the WR-MACD strategy by investing $10k in NVDA: 5014.22
Profit percentage of the WR-MACD strategy : 50%
  • Comparing backtest results against the SPY benchmark
def get_benchmark(start_date, investment_value):
    spy = get_historical_data('SPY', start_date)['close']
    benchmark = pd.DataFrame(np.diff(spy)).rename(columns = {0:'benchmark_returns'})
    
    investment_value = investment_value
    number_of_stocks = floor(investment_value/spy[-1])
    benchmark_investment_ret = []
    
    for i in range(len(benchmark['benchmark_returns'])):
        returns = number_of_stocks*benchmark['benchmark_returns'][i]
        benchmark_investment_ret.append(returns)

    benchmark_investment_ret_df = pd.DataFrame(benchmark_investment_ret).rename(columns = {0:'investment_returns'})
    return benchmark_investment_ret_df

benchmark = get_benchmark('2021-01-01', 10000)

investment_value = 10000
total_benchmark_investment_ret = round(sum(benchmark['investment_returns']), 2)
benchmark_profit_percentage = floor((total_benchmark_investment_ret/investment_value)*100)
print(cl('Benchmark profit by investing $10k : {}'.format(total_benchmark_investment_ret), attrs = ['bold']))
print(cl('Benchmark Profit percentage : {}%'.format(benchmark_profit_percentage), attrs = ['bold']))
print(cl('WR-MACD Strategy profit is {}% higher than the Benchmark Profit'.format(profit_percentage - benchmark_profit_percentage), attrs = ['bold']))
  • Output:
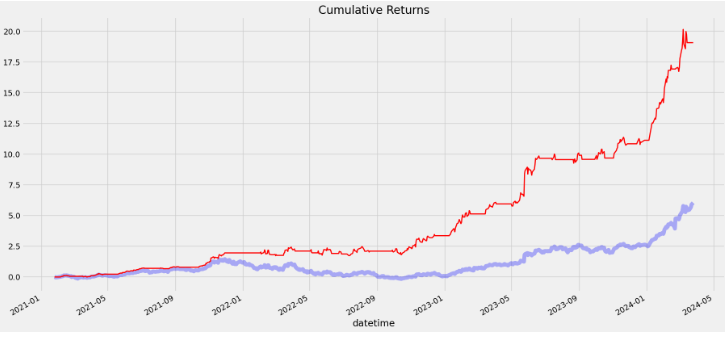
Benchmark profit by investing $10k : 2882.3
Benchmark Profit percentage : 28%
WR-MACD Strategy profit is 22% higher than the Benchmark Profit

Conclusions

  • Considering the current trends, indicators, and patterns, the technical outlook for NVDA is bullish and overbought, with bearish momentum.
  • Backtesting:
Profit gained from the WR-MACD strategy by investing $10k in NVDA: 5014.22
Profit percentage of the WR-MACD strategy : 50%
  • Benchmark Comparison:
WR-MACD Strategy profit is 22% higher than the Benchmark Profit
  • The MACD study has been used to identify stock buy and sell signals. When the MACD crosses above the signal line, it may be time for the longs to enter the market, whereas when a cross below the signal line occurs, it may be time for the shorts to enter the market.
  • As previously mentioned, the %R is used to measure momentum. %R oscillates within a fixed range between the values of 0 and -100. Williams himself set the parameters of overbought as any reading between 0 and -20.
  • Disclaimer: Technical Analysis is blind to the fundamentals and looks only at the trading data for NVIDIA.

References

Let’s connect!

GitHub

Website

Twitter

Python
Nvidia
Algorithmic Trading
Macd
Stock Market
Recommended from ReadMedium