Elementary of statistics you need to know

Measures Of Asymmetry:
Skewness: it indicates data is concentrated on one side. Skewness shows where the data is situated.
- There are three different skews
1. Right Skew
2. Left Skew
3. No Skew
We will learn about the types of skewness briefly.
1. Right Skew
If the mean is greater than the median then it is considered as a right skew.
- Mean > Median
2. Left Skew
In this type left skew is the opposite of the right skew, yes if the mean is lower than the median, we can say it is the left skew.
- Mean < Median
3. No Skew
In case the mean, median, mode all are equal then it is recognized as No Skew.
- Mean = Median = Mode
Variance :
- This measures dispersion of a set of data points around their mean (closer to the mean) between the low results.
- Remember, Dispersion is non-negative.
Why Inferential Statistics?
- In Statistics, Inferential statistics are similar to a probability distribution
- Usually, a distribution shows
possible valuesfor a variable and how often theyoccur.
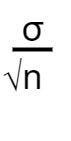
Standard Error:
The standard error is the standard deviation of the distribution which is formed by the sample mean. It shows variability in the sample.
Notation:
Estimators vs Estimates:
Estimates: A specific value is called estimate, and It follows two categories.
i. Point estimate [single number].
ii. Confidence Intervals.
Estimates: are judges, the expected value denotes population parameter.
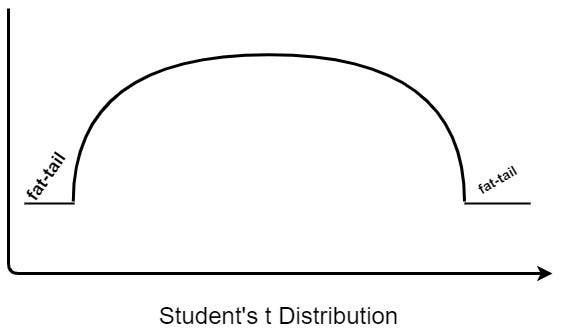
Student’s T distribution:
According to the student’s T distribution, It looks like normal distribution but it contains fat tails.
formula:
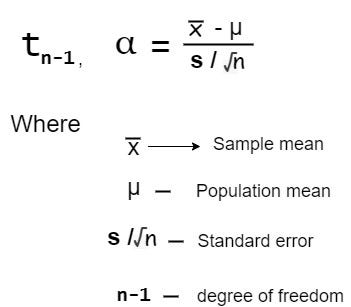
Example: If a sample of observation has 20 and its corresponding degree of freedom is 19. so it is considered as t-statistic.
In case let us consider the number of observations is greater than 30 it is taken as Z-statistic distribution.
The margin of error:
In the margin of error, a smaller z statistic or t-statistic or a standard deviation SD can reduce the margin of error.
- A higher statistic and standard deviation increase the margin of error and a higher sample size decrease the margin of error.
Thank you for spending time reading this article.