
A Complete Guide to Twitter Sentiment Analysis — Part I
A follow-along tutorial to guide you through the in-depth twitter sentiment analysis using Python
Twitter is a social media site, where people interact with the other users by posting messages called tweets, about topics they include in their posts using hashtags. Twitter is a rich source of data. Analyzing the tweets can give you important and interesting insights about what people are talking about, the sentiments of people, their opinions towards a particular topic/brand and the general trends in society.
This article is part 1 of the 2-part series that guides you through the complete process of sentiment analysis of Twitter data using Python. This article is aimed at the beginners who want to learn sentiment analysis in Python and assumes the readers to have basic understanding of Python.

1. Getting Started
To scrape the data from twitter, we will be using a twitter API. To be able to use this API, we have to create a developer account on Twitter’s site. Complete instructions on how to create an account can be found here.
Once you have successfully created the account, you get access to the following keys — Consumer Key, Consumer Secret, Access Token and Access token secret. Make sure to save them somewhere safe.
2. Authentication
Twitter API is accessed in Python using the library called Tweepy. The first step is to install this library in Python environment and perform the authentication of twitter account information.
!pip install tweepy
import tweepy
#Authentication information
consumer_key = "your_key"
consumer_secret = "your_secret"
access_token= "your_access_token"
access_secret = "your_access_secret"auth = tweepy.OAuthHandler(consumer_key, consumer_secret)
auth.set_access_token(access_token, access_secret)
api = tweepy.API(auth, wait_on_rate_limit = True, wait_on_rate_limit_notify= True)3. Scraping the tweets
The Twitter API is very flexible, in the sense that there are multiple ways in which you can get the data that intrigues you. (i) You can get the tweets of a certain user using the function user_timeline() (ii) You can retrieve all the geo tagged tweets using the function geo_search(). This function retrieves the tweets that are filtered by specific location. (iii) You can filter the tweets using a specific word or query.
I decided to search the tweets about the topic ‘covid’. I combined the multiple terms in the query using ‘OR’. I was hoping to find a range of sentiments in the tweets. With the vaccination program going strong in many countries, at the same time lockdown in others, I thought it would be interesting to understand and analyze what the twitter users have to say about coronavirus.
We used the following code for scraping 5000 tweets on the keywords corona virus in the English language.
corona_tweets = tweepy.Cursor(api.search,q = "Covid19 OR corona OR Coronavirus -filter:retweets",lang = "en", show_user = True,tweet_mode="extended").items(5000)
corona_tweets_list = [[tweet.created_at, tweet.place, tweet.user.name, tweet.full_text] for tweet in corona_tweets]
print(len(corona_tweets_list))
The tweets_list thus created is then converted into a data frame and saved into a csv file for later use.
#convert the list into dataframe
tweets_df = pd.DataFrame(corona_tweets_list)
#rename the columns
tweets_df.columns = ['Created at', 'Place', 'User', 'Text']
#save the dataframe as a csv
tweets_df.to_csv("C:/Users.../Corona_tweets.csv, index = False)
#The file saved above can be read as follows
tweets_df = pd.read_csv("C:/Users/.../Corona_tweets.csv", index_col = 0)4. Hashtag Analysis
Now that we have gathered our data, let’s get started with the interesting bit- analysis of tweets.
I decided to start with the hashtag analysis. Hashtags are special metadata tags that are widely used on microblogging services as a form of user-generated tagging that enables cross-referencing of content sharing a subject or theme.[Source — Wikipedia] Analyzing the hashtags help us understand what topics are trending on twitter.
We extract the hashtags from the tweets using the regex library in Python.
import re
def find_hashtags(tweet):
    #This function extracts hashtags from the tweets.
    return re.findall('(#[A-Za-z]+[A-Za-z0-9-_]+)', tweet)

tweets_df['hashtags'] = tweets_df.Text.apply(find_hashtags)
Hashtags thus found are saved in a column ‘hashtags’ in our tweets_df data-frame. These hashtags are then converted and stored into a list. The list thus created is a list of lists because some tweets have more than one hashtags associated with them. This list is flattened in the next line of code and converted into a data frame.
hashtag_list = tweets_df['hashtags'].to_list()
flat_hashtags_df = pd.DataFrame([item for sublist in hashtag_list for item in sublist])
flat_hashtags_df.shape
#change the name of the column to hashtags
flat_hashtags_df.columns = ['hashtags']
flat_hashtags_df.head()Following code helps us understand how many total hashtags there are in the dataset and how many of them are unique.
print("Total hashtags: ", len(flat_hashtags_df['hashtags']))
print("Repeated hashtags: ", len(flat_hashtags_df['hashtags'].unique()))
We get the following output Total hashtags: 8415 Repeated hashtags: 2649
This means that out of the total 8400 hashtags retrieved from the dataset, only 25% are unique.
We can plot the top 20 hashtags and their occurrences using the following code.
import matplotlib.pyplot as plt
flat_hashtags_df['hashtags'].value_counts()[:20].plot(kind='barh')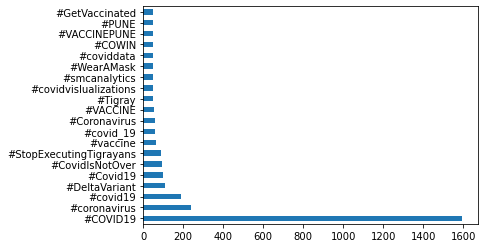
5. Cleaning up the tweets for further analysis
If we have a look at the tweets scrapped by the API, we will notice some strange characters like &, 🙠etc. These characters need to be removed. We also need to get rid of websites, hashtags(now that we have analyzed them already) and mentions of other users(starting with @). This is all done in the code below. You might need to include some more cleaning parts to suit your data.
#define a function to clean up the tweets. input - text field of all #the rows, output - cleaned text
def cleanUpTweet(txt):
    # Remove mentions
    txt = re.sub(r'@[A-Za-z0-9_]+', '', txt)
    # Remove hashtags
    txt = re.sub(r'#[A-Z0-9]+', '', txt)
    # Remove retweets:
    txt = re.sub(r'RT : ', '', txt)
    # Remove urls
    txt = re.sub(r'https?:\/\/[A-Za-z0-9\.\/]+', '', txt)
    #remove amp
    txt = re.sub(r'&', '', txt)
    #rempve strange characters
    txt = re.sub(r'ðŸ™', '', txt)
    #remove new lines
    txt = re.sub(r'\n', ' ', txt)
return txttweets_df['Cleaned_Text'] = tweets_df['Text'].apply(cleanUpTweet)Once the initial cleaning is done, our data is ready for the sentiment analysis.
6. Find the Average length of the tweets
After cleaning the tweets, let us try to find out the average length and average word count of the tweets. Length is calculated using the ‘len’ function and word counts are calculated by first splitting the text on the space character and then using the len function. Code for the same is given below:
#calculating average tweet length and word count
import numpy as np
tweets_df['text_len'] = tweets_df['Text'].astype(str).apply(len)
tweets_df['text_word_count'] = tweets_df['Text'].apply(lambda x: len(str(x).split()))print("Average length of tweets ", round(np.mean(tweets_df['text_len'])))
print("Average word counts of tweets", round(np.mean(tweets_df['text_word_count'])))Average length of tweets 137.0
Average word counts of tweets 23.0We can draw histograms for text length and word count to understand the distribution of the length of text and word count.
tweets_df['text_len'].plot(bins = 100, kind = 'hist',title = 'Histogram by length of tweets');
tweets_df['text_word_count'].plot(bins = 100, kind = 'hist', title = 'Histogram by the word counts of all tweets')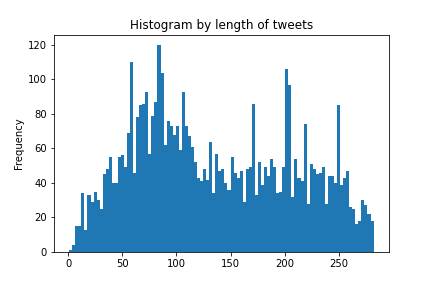
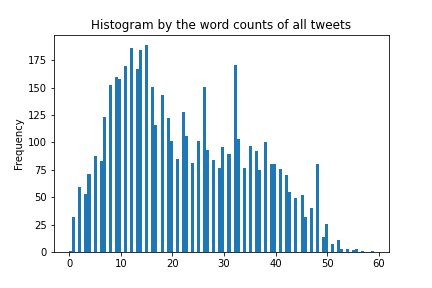
The histograms show that most of the texts are around 90 characters long. Average text length is about 137 characters and there are some outliers as well. Histograms for word counts tell the distribution by word count.
Conclusion
In this article we saw how to scrape the tweets in Python using twitter API, save them as a csv file , analyze the hashtags, clean the text fields and calculate the average text length and word counts. In the next part of this series, we will see how to perform sentiment analysis. We will also see how to create pie charts, word clouds and analyze the most popular words within the negative and positive tweets. Part II can be found here.
If this tutorial was worth your time, please feel free to have a look at some of by other popular articles that could be found here and here. Say Hi on linkedin if you like.