
Analysis of US presidential election 2020
Harshita Garg
The US presidential election 2020 was full of drama, excitement, confusion and controversies. The whole world watched with bated breath as Joe Biden was declared winner, despite Trump’s continued refusal to concede.

The analysis presented here is an attempt to understand how people of different ages, races and education levels felt towards the two election candidates- Donald Trump and Joe Biden.
The questions that we would try to answer here are:
- Is there any interesting pattern in voters’ feelings and their demographic data like age, sex, race and education?
- Do feelings of voters towards different races and ethnicities, affect their feelings towards Trump/Biden?
Data
The data for this analysis has been obtained from the website of American National Election Studies(ANES). ANES produces high-quality data by conducting online surveys on range of topics like voting, public opinion, and political participation.
First step for our analysis is to read data into an r data frame. Dataset can be downloaded from here.
data_2020 <- read.csv(“C:/Users~/anes_pilot_2020ets_csv.csv”, na.strings=c(“”,” “,”NA”))In this dataset, feelings of respondents towards different people/issues in these surveys are described by feelings thermometer, with values ranging from 0–100. In this article we will be using the abbreviation ft for feelings thermometer.
There are a total of 3080 rows and 365 predictor variables in data_2020. But we are only interested in the feeling thermometer columns and profile data like age, race, education and gender. So let us now create a new data frame that has all the columns that are of interest to us.
col_2020 <- c("fttrump1", "ftobama1", "ftbiden1","ftblack", "ftwhite", "fthisp", "ftfeminists", "age", "sex", "race7", "educ")
short_2020 <- data_2020[,col_2020]
A quick run of !complete.cases command tells us that there are no missing values in the datasets. But some values for ft columns in short_2020 has invalid value 999. Let’s get rid of these rows.
short_2020 <- short_2020 %>% filter_all(all_vars(. !=999 ))Exploratory analysis and visualization
Let’s draw some insightful plots and try to understand our data better.
ggplot(short_2020) +
  geom_histogram(aes(x=fttrump1,fill = "green", alpha = 0.3)) +
  geom_histogram(aes(x=ftbiden1,fill = "blue", alpha = 0.3), position = "identity") +
  scale_fill_manual(name="FT", values=c("green","blue"),labels=c("Trump","Biden"))  +
ggtitle( "Feelings Thermometer") 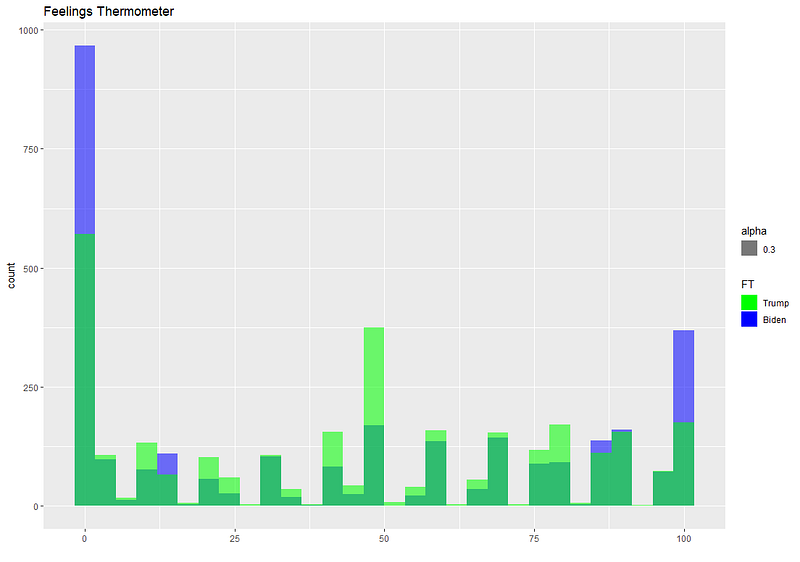
This is the plot for feelings distribution for Trump and Biden. In these histograms, we can see that there are more respondents who have warmest(100 degrees) feelings towards Biden than Trump, but there are also a large number of people who have cold feelings( 0 degrees) for both Biden and Trump. More people have 0 feelings for Biden than Trump. But the mean of overall feelings for Biden is more than that for Trump.
Let’s try and draw a correlation plot between all the variables of the data.
library(corrplot)
corrplot(cor(short_2020), method = "circle", type = "upper")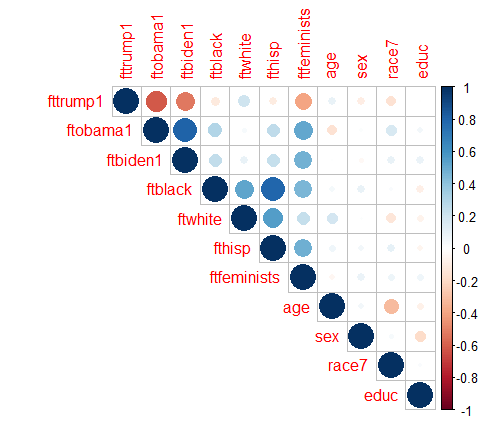
This plot gives us some interesting insights like:
- There is a negative correlation between feelings for Trump and Biden and also, feelings for Trump and Obama. This means that people who have voted as having warm feelings for Trump tend to have cold feelings for Obama and Biden and vice versa.
- There is a positive correlation between feelings for Obama and Biden. Which means as respondents feelings towards Obama increases, so does their feelings for Trump.
- There’s a small negative correlation between feelings for feminists and feelings for Trump. suggesting that people supporting feminists do not generally support Trump and vice versa.
These insights can be further confirmed by plotting data for people who have voted high for Trump and Biden. For this, we have to first make a subset of people whose feelings for Trump is ≥ 75 degrees. We then plot feelings of these people for different races like Black, White, Hispanics and feminists. We did the same for Biden as well and got the following plot.
#subset of people who voted > 74 degrees for Trump
trump_high_2020 <- short_2020[which(short_2020$fttrump1 > 74),]
#Draw frequency plots for ftblack, ftwhite, fthisp and ftfeminists
p1 <- ggplot(trump_high_2020)+ geom_freqpoly(aes(x= ftblack,color= "ftblack"), size = 1.5) + geom_freqpoly(aes(x = ftwhite, color = "ftwhite"), size = 1.5) + geom_freqpoly(aes(x = fthisp, color ="fthisp" ), size = 1.5) +geom_freqpoly(aes(x = ftfeminists, color = "ftfeminists"), size = 1.5)
# Add labels and colors
trump <- p1 + scale_color_manual(name = "FT", values = c(ftblack = "black", ftwhite = "yellow", fthisp = "green", ftfeminists = "red")) +labs(title = "People who voted high for Trump", x = "Feelings Thermometer")
biden_high_2020 <- short_2020[which(short_2020$ftbiden1 > 74),]
p1 <- ggplot(biden_high_2020)+ geom_freqpoly(aes(x= ftblack,color= "ftblack"), size = 1.5) + geom_freqpoly(aes(x = ftwhite, color = "ftwhite"), size = 1.5) + geom_freqpoly(aes(x = fthisp, color ="fthisp" ), size = 1.5) +geom_freqpoly(aes(x = ftfeminists, color = "ftfeminists"), size = 1.5)
biden <- p1 + scale_color_manual(name = "FT", values = c(ftblack = "black", ftwhite = "yellow", fthisp = "green", ftfeminists = "red")) + labs(title = "People who voted high for Biden", x = "Feelings Thermometer")#plot the 2 graphs together
grid.arrange(trump, biden, ncol = 2)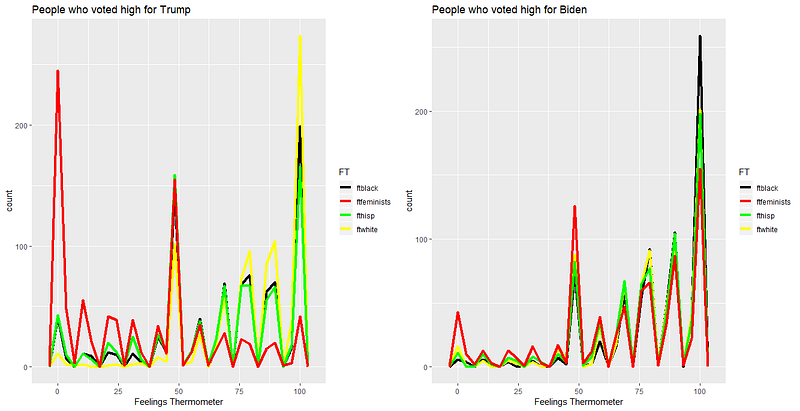
Above plots suggest that people who feel warm towards Trump generally have warm feelings for white and black races. They have mixed feelings for Hispanics and generally cold feelings for feminists. On the other hand, people who have voted high for Biden have mostly warm feelings for black, white and Hispanic races and mixed feelings for feminists. But in general, there is more support for feminists by Biden supporters than the Trump supporters.
Let us now try to find out how people from different races feel towards Trump. A plot of fttrump with respect to race variable can be done using the following code.
#convert race to a categorical variable
short_2020$race7 <- as.factor(short_2020$race7)
#getting rid of races with very few data points
less_races <- short_2020 %>% filter(short_2020$race7 != 7 & short_2020$race7 != 9)
#draw the plot
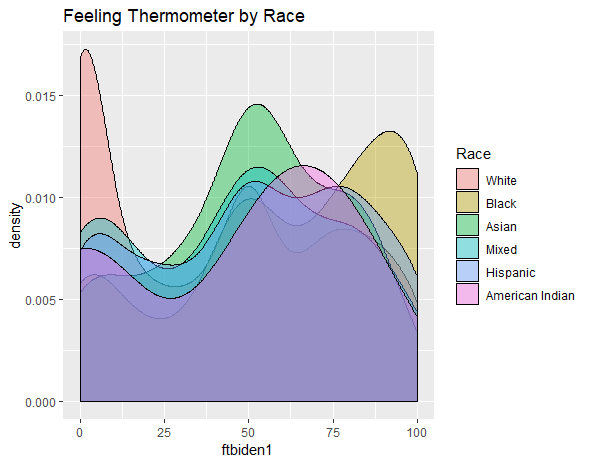
p <- ggplot(less_races, aes(x = fttrump1, fill = race7))+
geom_density(alpha = 0.4) + labs(title = "Feeling Thermometer by Race")
#fix the legend
p + scale_fill_discrete(name = "Race", labels = c("White","Black", "Asian","Mixed","Hispanic","American Indian"))We get the following plot:
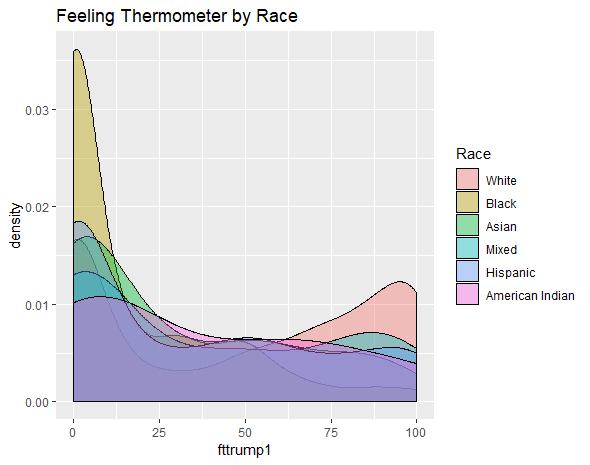
This plot shows a general pattern of how different races feel towards Trump. It suggests that black communities tend to have colder feelings towards Trump whereas White races have relatively warmer feelings. Other races have mixed feelings but in general, people from the races Asian, Mixed and Hispanic races feel more cold towards Trump than warm.
A similar plot for feeling Thermometer for Biden was drawn:
This plot shows that a large number of white people have 0 degrees warmth towards Biden, whereas a large number of blacks and Hispanics generally feel warm towards him. Asian and mixed races have mixed feelings for Biden, but general trend is warmer than colder.
Let us now try and see if we can identify any pattern in education of respondents and their feelings towards the 2 candidates. For this, we first group them by education and find their mean feelings. This data is then plotted on the graph.
#Group by education and find mean
educ_ft <- short_2020 %>%  group_by(`educ`, educ)%>%   summarise_at(vars("fttrump1", "ftbiden1"), mean)
#convert mean to factor
educ_ft$educ <- as.factor(educ_ft$educ)
#Plot the data
p1 <- ggplot(educ_ft)+geom_point(aes(x= educ, y = fttrump1), shape = 19, size = 4, color = "red") + geom_point(aes(x=educ, y = ftbiden1), shape = 15, size = 4, color = "green")
#Display education levels on the plot
p2 <- p1+  scale_x_discrete(labels = c("<= 12th grade", "High School Diploma", "No degree", "Associate degree", "Bachelor's degree","Master's Degree", "Professional Degree", "Doctorate"))
#display titles and axes labels
p2 + theme(axis.text.x=element_text( size=11, angle=30, vjust=.8, hjust=0.8))+labs(title = "Mean Feelings by Education") + xlab ("Education")+ ylab("Mean feelings")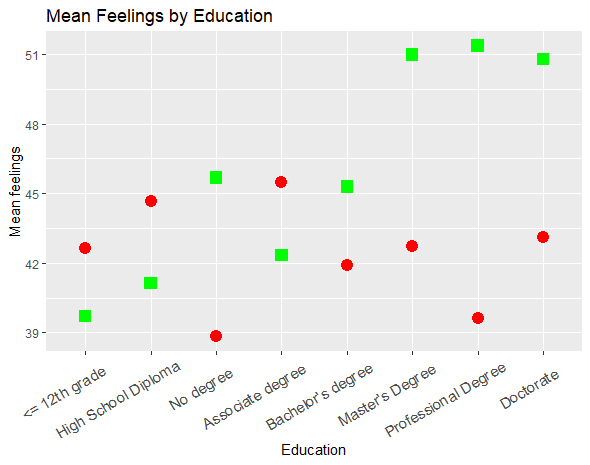
This graph shows that respondents with higher education level like Masters, professional degree and doctorate tend to have warmer feelings towards Biden. Trump on the other hand is supported more by people who have studied till 12th grade and who have high school diplomas / associate degrees.
Now, we want to plot the ft by sex. Since we want feelings for both Trump and Biden to be plotted against sex on the same plot, we have used the melt function from the library reshape. You can read more about this function here.
short_2020$sex <- as.factor(short_2020$sex)
library(reshape)
#melt the data
m_2020 <- melt(short_2020, id.vars = 'sex', measure.vars = c('fttrump1', 'ftbiden1'))
#plot the boxplots
p1 <- ggplot(m_2020) + geom_boxplot(aes(x=sex, y=value, fill=variable))
#fix axes and titles of the plot
p1 + scale_x_discrete(labels = c("Male", "Female"))+ labs(title = "Feelings by sex", fill = "Feelings Thermometer" )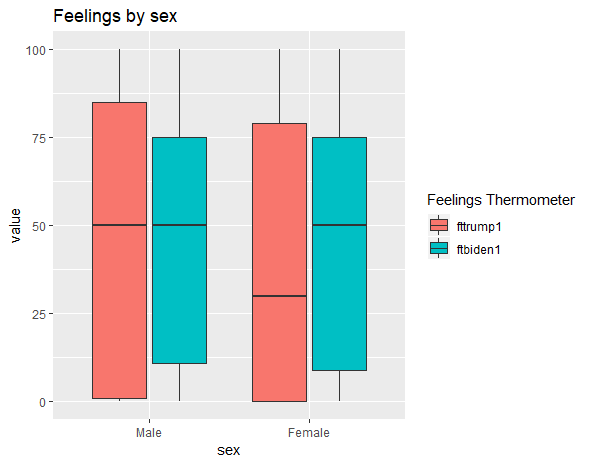
Mean feelings of females is a lot lower for Trump than that of males for Trump. For Biden, mean feelings of males and females is approximately the same(nearly 50 degrees).
Lastly, lets plot ft against age to see if we can find any patterns. A simple scatterplot of feelings thermometer by age failed to give any useful results. Therefore, age was divided into age groups of 10 years and plotted them against the sum of their feelings.
#create age range
short_2020 <- short_2020%>%mutate(AgeRange = cut(age, breaks = c(18,30,40,50,60,70,80,90)))
#plot feelings thermometer by age
p1 <- ggplot(short_2020, aes(x=AgeRange, y = fttrump1, fill = “green”, alpha = 0.3)) +geom_bar(stat = “identity”)
p2 <- p1 + geom_bar(aes(x = AgeRange, y = ftbiden1, fill = “blue”, alpha = 0.3), stat = “identity”)
#fix the labels
p2 + scale_fill_manual(name=”FT”, values=c(“green”,”blue”),labels=c(“Trump”,”Biden”))+ ggtitle( “Feelings Thermometer by Age”)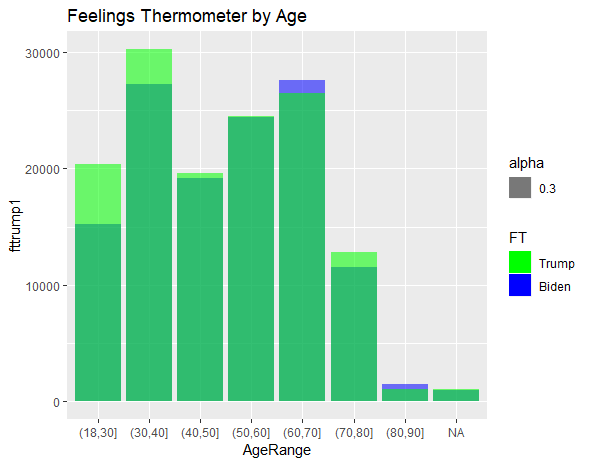
This plot shows that younger people tend to have warmer feelings for Trump than Biden. People in the age range 60–70 years and 80–90 years favoured Biden slightly more than Trump.
Conclusion
After plotting all the graphs and careful analysis of the given data, we arrived at the following conclusions:
- Trump has lots of supporters from white race but not so many from black. Biden on the other hand has a large number of supporters from black race, with an equally large number of white people not supporting him.
- As the level of education increases, so does the chances of people supporting Biden.
- Comparatively younger voters favor Trump more than Biden and Trump has lesser female supporters than males.
- People who feel warm towards Trump also have warm feelings for White and black communities but not so much for feminists.
In the next part of this article We will try to analyze how voter feelings changed towards Trump in four years from 2016 to 2020.