avatarCody Collins

Free AI web copilot to create summaries, insights and extended knowledge, download it at here

2008

Abstract

herefore, if the 2-year yield is higher than the 10-year yield, the price for a 2-year treasury is lower. This signals that investors are less optimistic about the short-term economy (2 years) than about the long-term economy (10 years).</p><h2 id="cfa4">Recent Inversions</h2><p id="75c6">The yield curve has slowly been declining over recent months. It mostly slipped by without investors noticing (myself included). There’s been plenty of other market and world news occurring.</p><figure id="550d"><img src="https://cdn-images-1.readmedium.com/v2/resize:fit:800/1*x0OaqPUPcvRTBASbi_VvIg.png"><figcaption>Yield Curve since January 1, 2021</figcaption></figure><p id="4dc4">The first notable yield curve to invert earlier this week was the <a href="https://www.cnbc.com/2022/03/28/us-bonds-treasury-yields-invert-flashing-recessionary-warning-sign.html">5-year and 30-year</a> Treasury yields. It inverted on Monday for the first time since 2006, a year before the Great Recession.</p><p id="b711">For a few brief seconds on Tuesday, the 2-year and 10-year yield curves inverted. It went mainly unnoticed because it was for such a short time.</p><p id="c6ce">On Thursday, the <a href="https://www.cnbc.com/2022/03/31/2-year-treasury-yield-tops-10-year-rate-a-yield-curve-inversion-that-could-signal-a-recession.html">yield curve was negative for a notably longer time</a>. This sent stocks down as $SPY dipped Thursday afternoon. The inverted curve was short-term as it ended the day positive, <i>at 0.01%</i>.</p><p id="1df0">It currently (as of Saturday, 04/02) sits inverted at (0.06)%.</p><p id="39e9">The curve needs to be inverted for a longer duration to be a valid recession signal.</p><h2 id="2c63">When a Recession May Come</h2><p id="5503">Speaking of recessions, just because the yield curve inverts does not guarantee <a href="https://readmedium.com/two-signs-a-recession-is-coming-c94d9d447c1b">an impending recession</a>. It also does not mean a recession will occur very soon. In fact, it u

Options

sually means a recession is around a year away.</p><blockquote id="ee24"><p>According to <a href="https://www.cnbc.com/2022/03/31/2-year-treasury-yield-tops-10-year-rate-a-yield-curve-inversion-that-could-signal-a-recession.html">MUFG Securities</a>, the yield curve inverted 422 days ahead of the 2001 recession, 571 days ahead of the 2007-to-2009 recession and 163 days before the 2020 recession.</p></blockquote><p id="e484">Another reason an impending recession is not likely is where our interest rates currently are. The Federal Reserve is in the process of raising interest rates, but they just started; interest rates are still very low.</p><p id="de14">Previous recessions occurred after the Fed leveled off its rate increases — <i>not in the middle of their increases</i>. The Federal Reserve still plans to raise rates for <a href="https://readmedium.com/inflation-isnt-going-anywhere-soon-c016d1d4d38b">many coming months</a>. As things currently stand, I expect the Fed to keep raising rates until mid-2023.</p><div id="aa85" class="link-block"> <a href="https://readmedium.com/can-the-next-recession-be-predicted-this-easily-9fbff52e0acd"> <div> <div> <h2>Can the Next Recession Be Predicted This Easily?</h2> <div><h3>Interset rates show us when to expect it</h3></div> <div><p>medium.com</p></div> </div> <div> <div style="background-image: url(https://miro.readmedium.com/v2/resize:fit:320/1*oh6Y-XhDH_AqI-bG3dRBRA.jpeg)"></div> </div> </div> </a> </div><p id="3608">Which would lead us to perfect timing of when the Federal Reserve levels off interest rates and 386 days (the average number of days based on the previous three examples for a recession to occur after the yield curve inverts). But remember, timing the market is difficult, and don’t blindly follow strangers’ advice on the internet.</p></article></body>

Dump Your Stocks ASAP

A Recession Indicator Screaming “Sell”

Image from Canva

First off, don’t actually sell your stocks. I hope that in 2022, most people will be mindful enough not to follow the advice of strangers online.

Plus, it’s better to hold your stocks for the long term anyway; timing the market is difficult.

There is, however, a major market indicator that flashed signs of a recession. The infamous yield curve inverted this week. But that doesn’t indicate a recession must be coming soon.

Yield Curve

First, a quick overview of what the yield curve is. If you’re already familiar with it, skip this section.

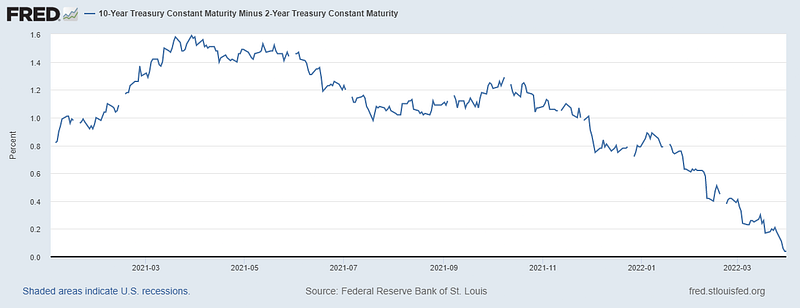
When investors talk about the “yield curve” they are referring to the difference between two different treasury yields. The most-watched yield curve is the 10-year minus the 2-year.

If the 10-year is offering a 2.80% yield and the 2-year offering a 2.60% yield, the yield curve would be 0.20%.

When the yield curve goes negative, that means the yield on the 2-year Treasury is higher than the 10-year Treasury. This is referred to as an inverted yield curve.

For example, if the 10-year offered a 2.47% yield and the 2-year offered a 2.50% yield, the spread would be 2.47% minus 2.50% = (0.03)%.

Most times, the 10-year yield would be higher than the 2-year, which is why it is often a sign of a recession when these two invert.

Bond yields move opposite of price.

If the yield of a bond moves up, that means its price is going down. Therefore, if the 2-year yield is higher than the 10-year yield, the price for a 2-year treasury is lower. This signals that investors are less optimistic about the short-term economy (2 years) than about the long-term economy (10 years).

Recent Inversions

The yield curve has slowly been declining over recent months. It mostly slipped by without investors noticing (myself included). There’s been plenty of other market and world news occurring.

Yield Curve since January 1, 2021

The first notable yield curve to invert earlier this week was the 5-year and 30-year Treasury yields. It inverted on Monday for the first time since 2006, a year before the Great Recession.

For a few brief seconds on Tuesday, the 2-year and 10-year yield curves inverted. It went mainly unnoticed because it was for such a short time.

On Thursday, the yield curve was negative for a notably longer time. This sent stocks down as $SPY dipped Thursday afternoon. The inverted curve was short-term as it ended the day positive, at 0.01%.

It currently (as of Saturday, 04/02) sits inverted at (0.06)%.

The curve needs to be inverted for a longer duration to be a valid recession signal.

When a Recession May Come

Speaking of recessions, just because the yield curve inverts does not guarantee an impending recession. It also does not mean a recession will occur very soon. In fact, it usually means a recession is around a year away.

According to MUFG Securities, the yield curve inverted 422 days ahead of the 2001 recession, 571 days ahead of the 2007-to-2009 recession and 163 days before the 2020 recession.

Another reason an impending recession is not likely is where our interest rates currently are. The Federal Reserve is in the process of raising interest rates, but they just started; interest rates are still very low.

Previous recessions occurred after the Fed leveled off its rate increases — not in the middle of their increases. The Federal Reserve still plans to raise rates for many coming months. As things currently stand, I expect the Fed to keep raising rates until mid-2023.

Which would lead us to perfect timing of when the Federal Reserve levels off interest rates and 386 days (the average number of days based on the previous three examples for a recession to occur after the yield curve inverts). But remember, timing the market is difficult, and don’t blindly follow strangers’ advice on the internet.

Money
Business
Technology
Economics
Cryptocurrency
Recommended from ReadMedium