
CRYPTOCURRENCY
20% Profit in BTC Copy Trading with an Open-Source Bot Through the FTX Crash
How to use a free and open-source trading bot to follow the strategies of seasoned algo traders.

A little over three weeks ago, I introduced you to the recent exploits of Superalgos, an open-source project enabling copy-trading among community members.
The TL;DR version is:
- The free and open-source Superalgos Platform is the top trading search result on GitHub after five years of continuous development.
- The project attracts great minds and encourages team-work so that users pool skills to become smarter, stronger, and faster.
- Some groups have achieved consistent profitability with various automated strategies.
- The project features a collective business model and incentivizes contributions with its native token, including broadcasting signals.
- Community members who lack their own profitable strategies may use their bots to follow others free of charge.
Here’s the complete article in case you wish to dive into the details:
Now I’m back to share my personal experience copy trading the first signal broadcasted by one of these teams in the Superalgos ecosystem!
I’m talking about Signalytic’s Trend Soaring. The signal is optimized for the BTC-USDT spot market. I’m running the bot on a Raspberry Pi so that it can be up 24/7 independently of my daily use of other machines in my household. Some users chose to run the bot in the cloud and even on an old Android phone!
First Week, October 21st — 27th
The first half of the week was quite boring for trading as the market was ranging between $18.5k and 19.5k, with record-low volatility until the breakout on the 25th.
Until the 25th, I was up 1.5% in BTC, and the max draw-down was 1%.
That was a curious period and a good test run, as it’s surprisingly easy to lose money in a low volatility context. The usual problem is that slippage and fees tend to eat up whatever performance a strategy may deliver.
In this case, slippage was minimal as I was testing the signal with 0.01 BTC. Fees were also not a problem, as I’m trading the BTC-USDT market in Binance, currently with zero fees.
Things got a bit more interesting after the breakout of October 25th.
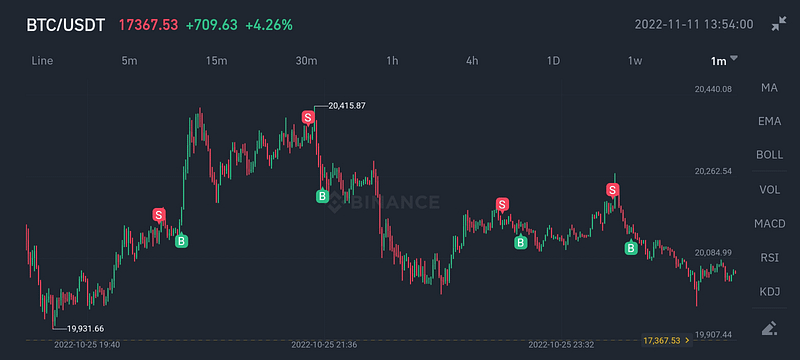
I’m taking these screenshots on the 1-minute chart of the Binance mobile app. What you see are sell [S] (red) and buy [B] (green) market orders plotted by the 1-minute candle where the orders where filled.
As you can see, it’s a scalping strategy with positions spanning a few minutes. The above image shows four beautiful hits selling BTC high and re-buying at a lower price to accumulate BTC.
Regrettably, the Binance mobile app doesn’t plot the order icon precisely at the price level at which the order got filled. Instead, it plots the icon above the candle (for sell orders) and below the candle (for buy orders). This partially distorts the visual representation of each position, making it look better in terms of performance than it actually is.
The Superalgos UI plots orders at the precise price level at which orders get filled, but I don’t have captures of the Superalgos UI for the first two weeks. You’ll get them for the last segment of the run!
Here you can see a few more scalps during October 26th:
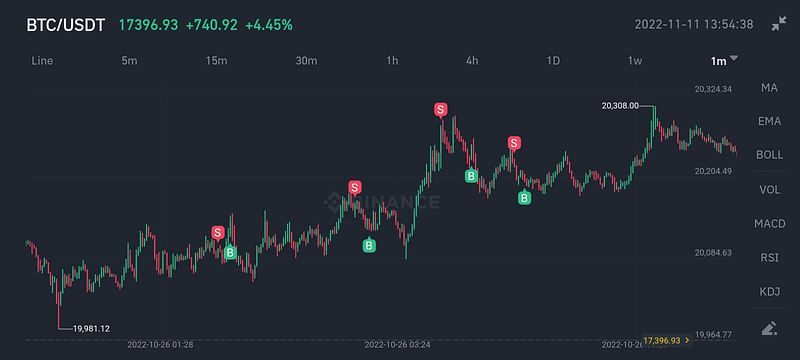
That first position was a fail, but the other three were hits.
Notice how all trades start with a sell order and end with a buy order. That means the trading system is bullish at this point, standing on BTC assuming that the price tends to go up and attempting quick scalps to increase the BTC balance when the price drops momentarily.
I don’t know how the trading system evaluates trends or scalping opportunities, as I don’t know the logic behind it.
The strategy is kept secret by its authors. All I can see are the orders my bot places while following the signal in an automated fashion.
Also on the 26th, a couple more fails followed by a hit, and another spike in price.
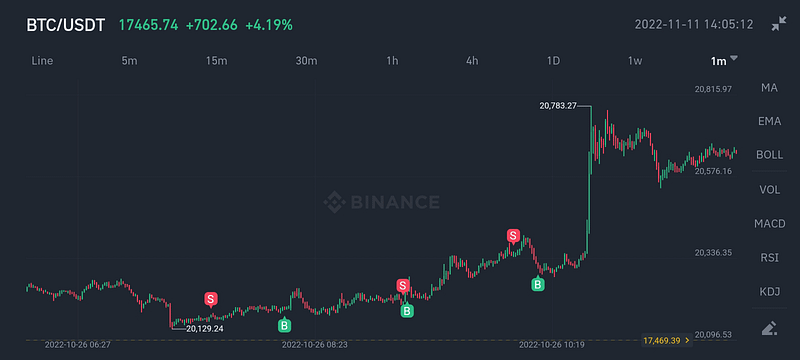
The first two positions on the image where fails, and the third one — right before the spike up — was a hit.
On the 27th, I got an error and the bot stopped.
I reported the issue over the project’s Telegram groups only to find that the devs had already merged an improvement that would likely fix my issue. I updated my bot, started it again, this time with 0.1 BTC, and have been running without any errors since.
Second Week, October 28th — November 3rd
This is the week in which the market retested the $20k support zone several times and Bitcoin Twitter was becoming bullish. Was the bottom in? Many thought it may!
With proper volatility back on, I was eager to see how the strategy would behave.
Take a look at a few trades on the 28th:
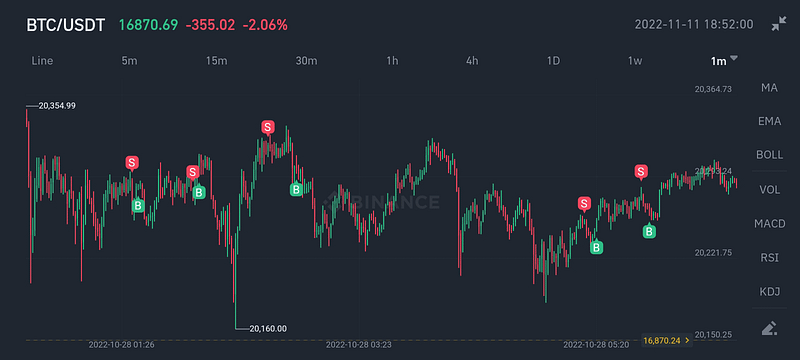
Most of the positions are short, under ten minutes, and also quite shallow in terms of P&L, ranging from -0.2% to 0.2%. It’s a patient accumulation game! The good thing is that you don’t need to pay much attention during the day, if any. The bot just goes on and on and on…
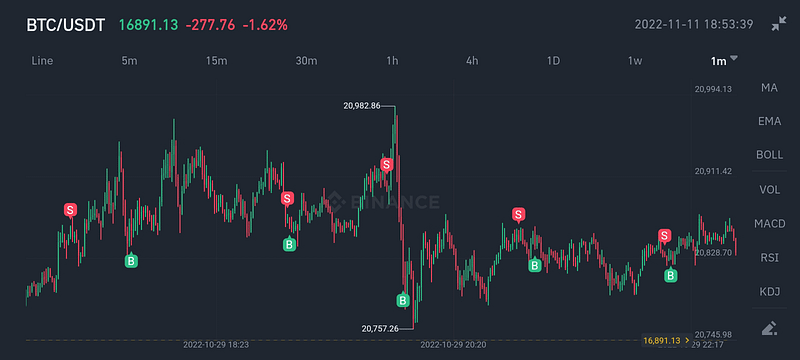
Also on the 28th, here’s an example of a longer position spanning almost one hour:
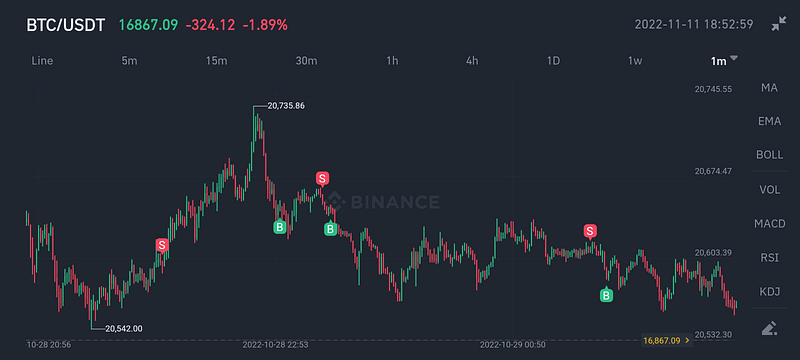
That’s the first position in the image, and it’s a clear fail as the bot bought at a higher price. Then, a couple of hits to compensate the ephemeral loss.
This other capture of October 29th shows a deeper position winning around 1% on a single shot. It’s the one in the middle of the image.
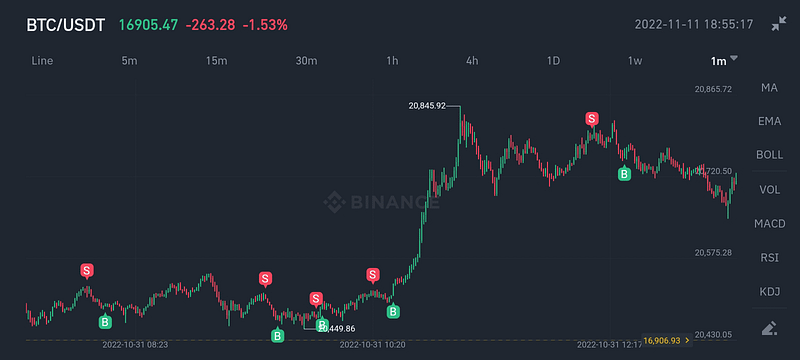
Next, on the 31st, there’s a great example of why it pays to stand in BTC when the system is bullish: scalp, scalp, scalp, and scalp on more time, then hold BTC! Wait while the price is hiking up, and then start scalping again! Beautiful!
Now, let’s jump to November 2nd and see what happens during an anomaly.
The first three positions are quick scalps. At least two fail but lose very little. Then something crazy happens! A scam wick spanning almost $600, up and down, in a single minute.
The strategy stays put, keeps holding BTC, does nothing, and waits for the next scalping opportunity.
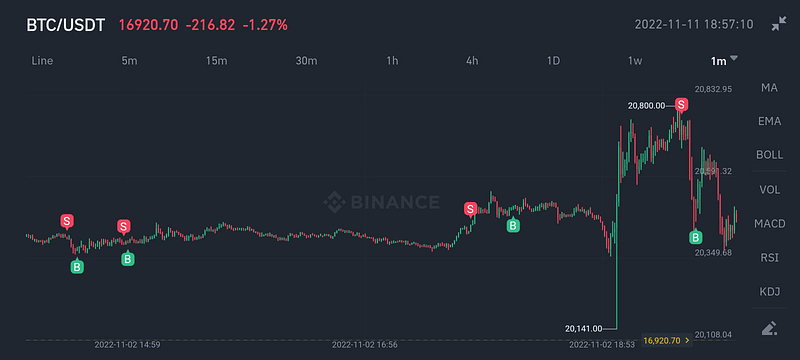
And boom! It hits a killer 2% win!
During this period, I got to be almost 1% down by October 30th. Then I went back up above the break-even line and ended November 3rd about 1.5% up.
That’s a very similar range to what I experienced the first week of extremely low volatility.
Up to this point, my first impression was that the strategy seems safe, handles anomalies well, is rather conservative, and doesn’t take too many risks.
That said, two weeks is a very small sample to draw meaningful conclusions, so I take all this as inconclusive anecdotal observations.
Third Week, November 4th — November 10th
This was likely the craziest week in the history of Bitcoin since the collapse of Mt. Gox.
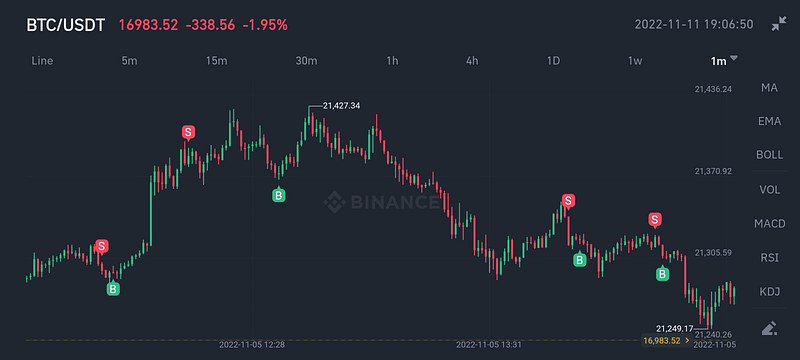
It started with a rally to $21.4k on the 4th and 5th. Given that the $20k support zone had been tested thoroughly the previous week, traders where starting to get excited. The end of the accumulation period spanning five months was likely coming to an end, and the next bull run was knocking on the door.
The strategy seems to trade less as the market moves up, which is understandable and even desirable if your goal is to accumulate bitcoin, like me.
The image below shows the local top at $21.4 with a couple of good old scalps on either side:
Everything was looking good for bitcoin until the shit hit the fan.
Binance’s CEO dropped a massive bomb that hit the industry where it hurts the most: on the trust we all put in centralized exchanges, a crucial piece of the current infrastructure that connects the fiat world with bitcoin.
The local top at $21.4k on November 5th suddenly became immutable. Such a bombshell wouldn’t allow breaking through that resistance zone any time soon.
The strategy, however, immune to bad news, continued scalping as if nothing had happened.
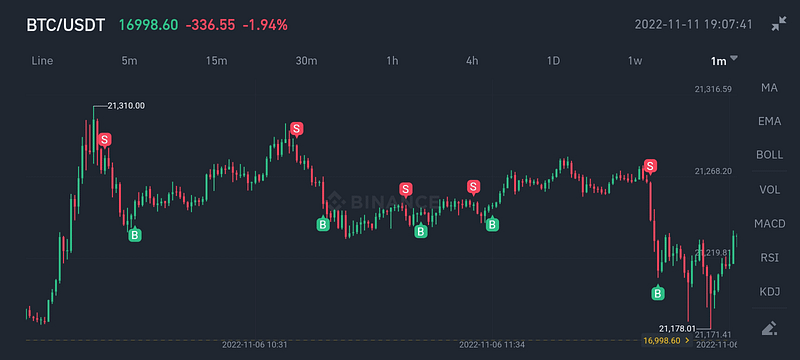
Nervousness in the market made for some added volatility that resulted in a few good trades in the aftermath of this first tweet.
On November 7th, bitcoin continued the slide as speculation mounted and tidbits of information emerged despite SBF’s futile attempts at playing things down.
The strategy, oblivious to the developments on Bitcoin Twitter, kept on holding bitcoin and scalping.
Until then, I was 2% up in BTC terms for the first half of the week, having never been negative!
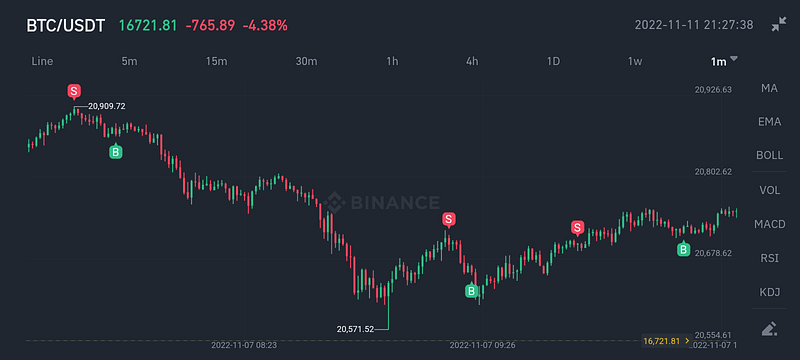
Then came the second tweet, on November 8th.
CZ confirmed first-hand what had only existed in the plane of rumors until then, and the market went apeshit cutting through all existing support zones like butter with a hot knife.
Still, the strategy played it cool and didn’t rush.
That was the last attempt at scalping before the decisive slide back below $20k.
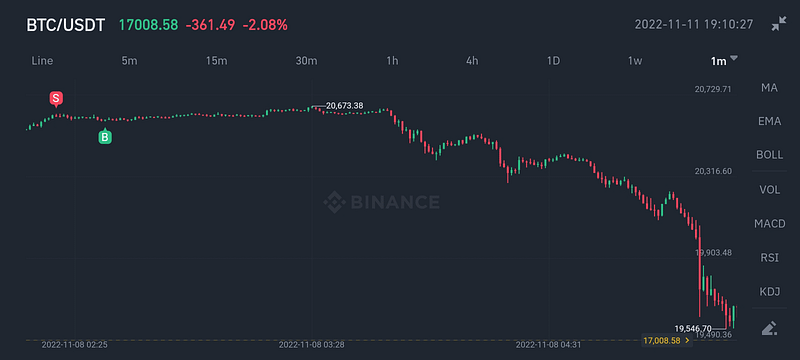
Now see what happened after the first move was over on the $19.7k zone.
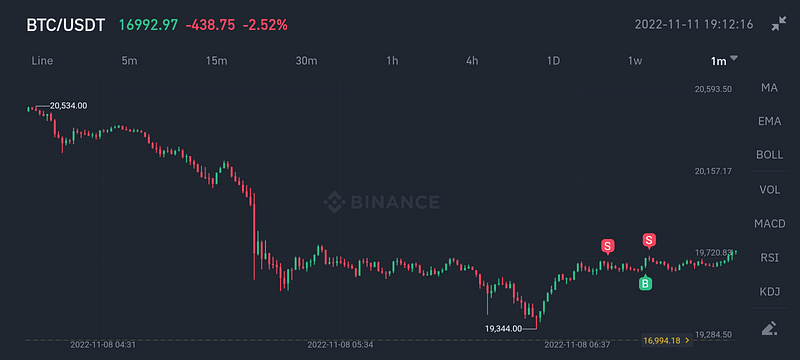
The trading system places yet another bullish scalp, but immediately after, sells all BTC deciding to stand on USDT instead.
My reading is that, while scalping happens in the span of minutes, the system evaluates the trend at higher time frames and this significant move tilted the trend to a bearish state.
The next few positions confirmed the suspicions.
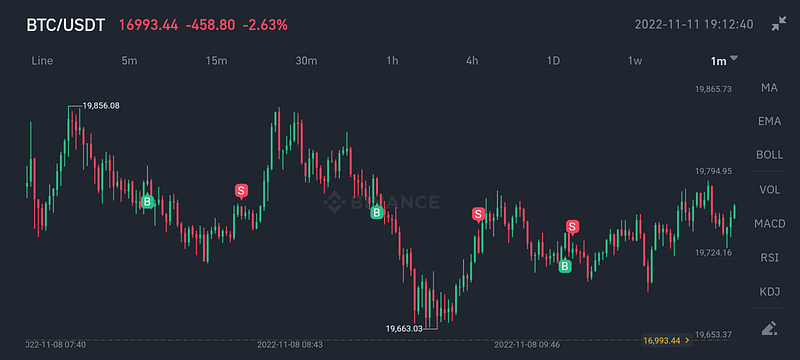
Notice how the system now buys first, and closes the position selling, standing on USDT while inactive.
Still, during November 8th, the slide down continues moderately, and the system keeps scalping standing on USDT.
After the last position of November 8th, with BTC trading at $18.4k, I was up 5% in BTC (cumulative with the previous week’s results).
It seemed like the market was happy to wait it out in the $18k–19k range, but Binance put the final nail in the coffin soon after, on November 9th:
Lucky for me, the strategy knew the bullish trend had vanished, and I was standing on USDT throughout the slide down to below $15.5k.
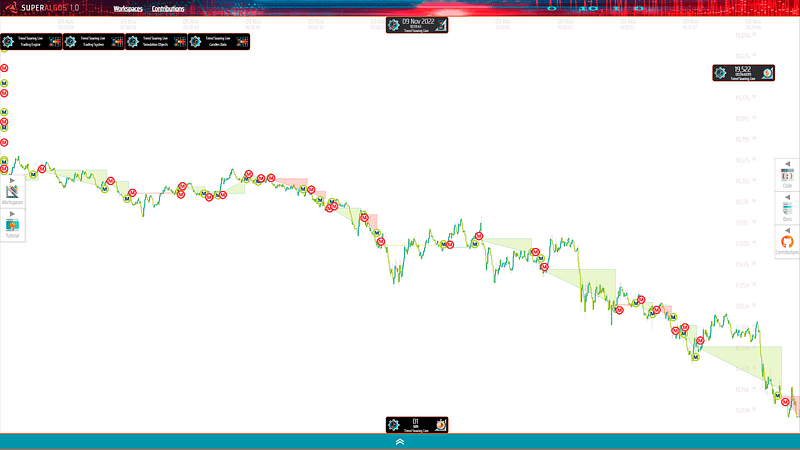
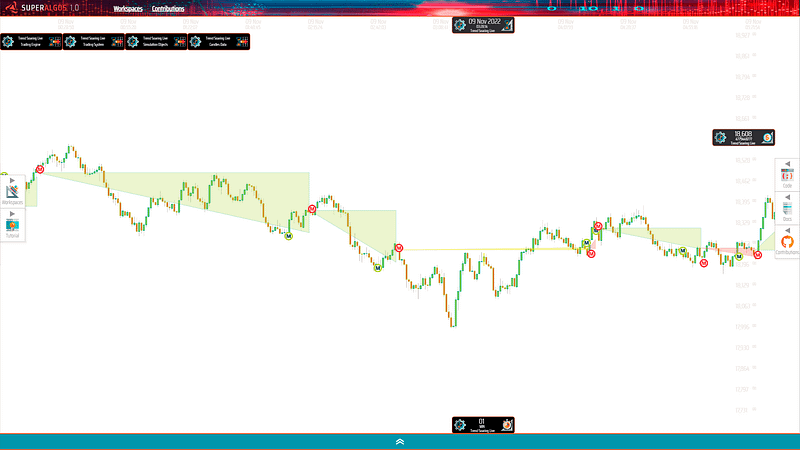
This is how the slide down looked in Superalgos’ visual representation of the live trading session:
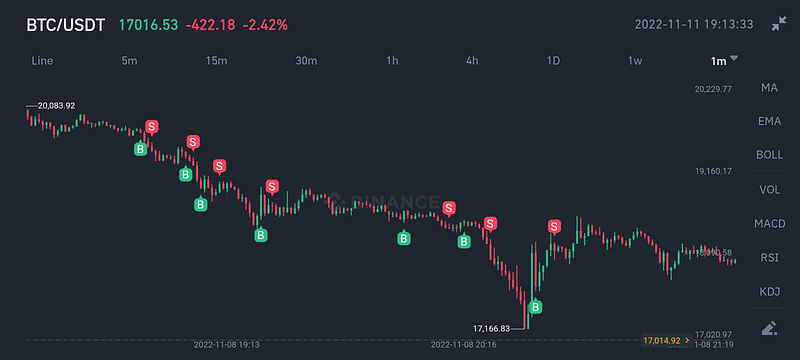
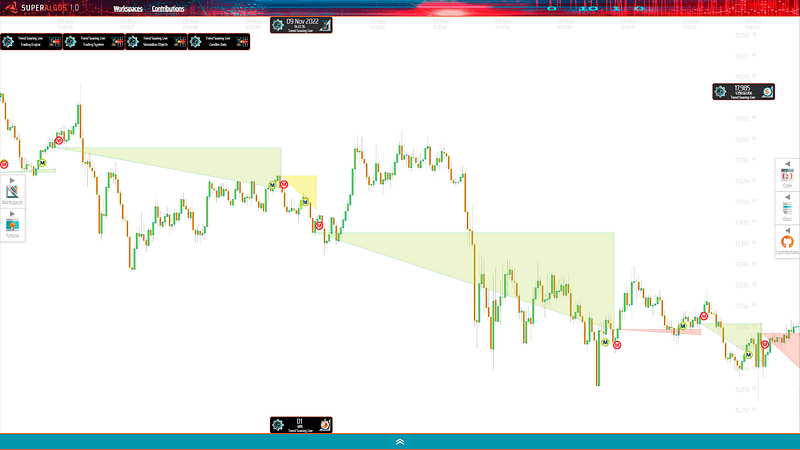
The following are two similar views of the slide to $15.5k split in shorter spans of time for clarity:
… and:
As hinted earlier, Superalgos plots the icons representing buy and sell orders at the exact price level in which orders get filled.
For improved visibility of each individual position, the interface offers a layer marking the span of positions with a triangle. The horizontal side marks the target price the strategy was aiming for to enter the position, and the vertical side marks the difference in price upon closing the round trip.
By the end of November 9th, I was 23% up in BTC!
November 10th saw a significant rebound as bitcoiners rushed to buy the dip, getting back up to the $17k-$18k range.
Because the move was sudden, with some whales buying massive amounts of coins in a single minute, the strategy remained bearish, standing on USDT and scalping with a bearish view.
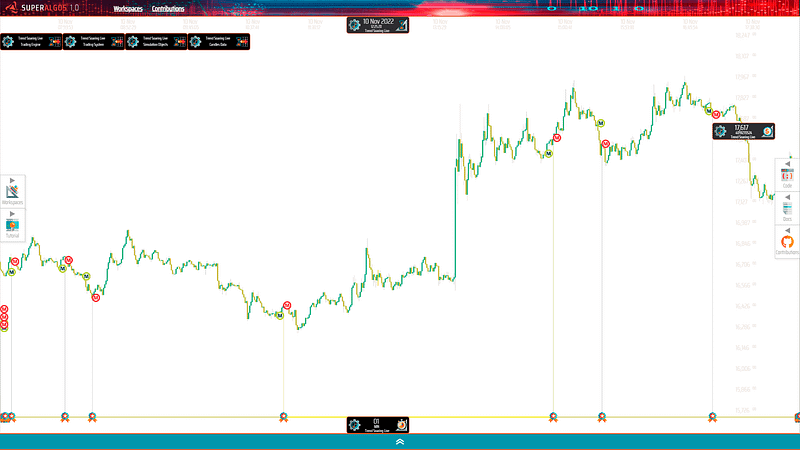
The sudden upwards move costed about 7% in BTC, but the loss averaged to 3% when counting the successful scalps of the day.
That is how I ended the craziest week since Mt. Gox with a 20% profit in BTC!
After analyzing the results copy trading this particular signal for three weeks, I decided to double the size for the next couple of weeks, to keep collecting data with some skin in the game.
So far, I encountered one clear switch from a bullish to a bearish trend, several anomalies with rapid moves triggered by catastrophic news, both extremely low and extremely high volatility contexts, and everything in between. It’s been an intense live testing run so far!
I’m eager to learn how the strategy will behave when the trend turns bullish again. In the meant time, I’m hoping I’ll keep growing my bitcoin holdings which is exactly what I’m after!
How to Jump Onboard
Superalgos is an open-source project. The new copy trading dimension has opened up the otherwise sophisticated Superalgos Platform to a whole new niche. If you’re well versed with operating computers and are able to follow instructions, you should be able to handle the somewhat steep learning curve and deploy your copy trading bot in a few hours.
The community is incredibly welcoming and you will get all the help you may need to join the ranks of copy traders.
And please, allow me to add something before I let you go.
You’re a one lucky bastard!
People in the community have been working tirelessly for years to get to the point in which profitable strategies start emerging. On top of that, the project spends zero dollars in marketing. It grows purely through word-of-mouth.
You’re quite lucky to have found the review of this first test run and to be one of the first few to join the project at this stage.
The article below offers all the details you need to get started:
Want to Know What Happens Next?
As I said, I already doubled the size, and the bot is still trading live as I write. If you wish to stay in the loop and find out how the next few weeks impact my BTC bag, follow me and subscribe to get email notifications.
And please, remember that none of the above is financial advice. Trading is inherently risky and you may lose all or part of your capital. Also notice that performance in backtesting is not an indication of live trading performance and that live performance is not an indication of future performance! Copy trade at your own risk!