
Z-Distribution or Z-Score Application in Machine Learning
Data pre-processing concept
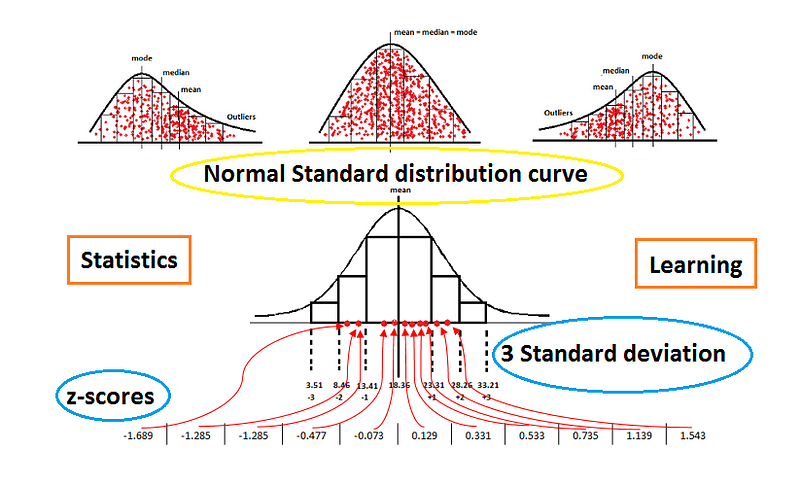
In this article, the Z-score is a way to standardize the data to standard scale i.e. how far the data point is from the mean. The z-score can come positive or negative based on the help of mean and standard deviation values.
The data point away from the mean with some standard deviation is called a z-score.
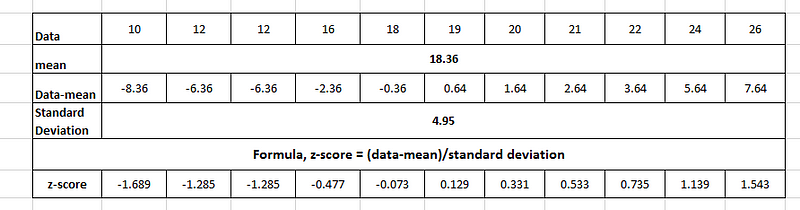
The formula to get the z-score is shown below:
z = (data point - mean)/standard deviation The z-score can be perfectly found in a normal distribution curve with no left skew and right skew. The below image shows these curves.
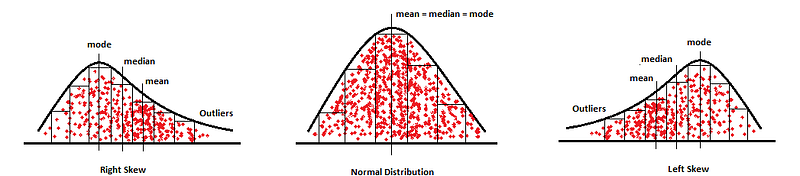
Normal Distribution: The normal distribution is a curve in which the data is spread symmetrically on both sides of the mean.
Right Skew: The data is mostly skewed on the right side because most of the data is on the right side. If we talk about outliers they are mostly on the right side too.
Left Skew: The data is mostly skewed on the left side because most of the data is on the left side. If we talk about outliers they are mostly on the left side too.
Mean and Standard Deviation
Mean: The mean is an average value of the data that tells about the center value of the data.
Standard deviation: It is a spread of the data around the mean with one standard deviation.
Finding the one standard deviation from the raw data
Let’s have raw data

the mean of the data is
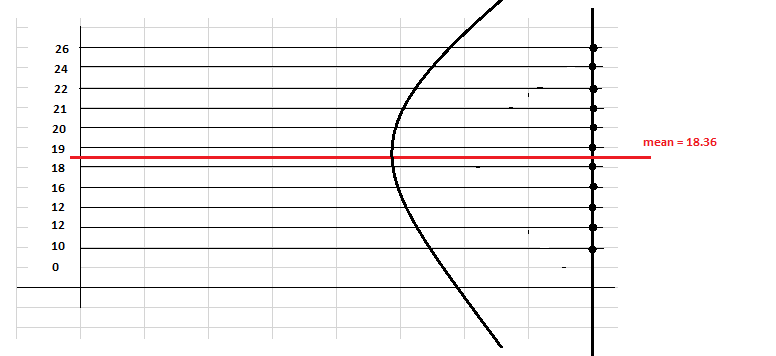
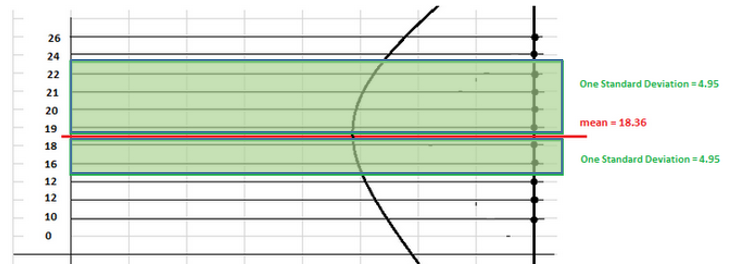
mean = total sum of values/total number of data = 202/11 = 18.36Let’s draw the distribution curve along with the data point for a clear visual understanding.
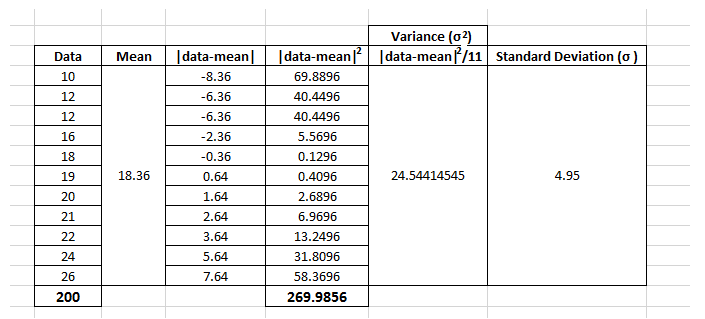
variance: It is the average sum of the squared difference value from the mean. As we see the difference between the number and the average of the data.
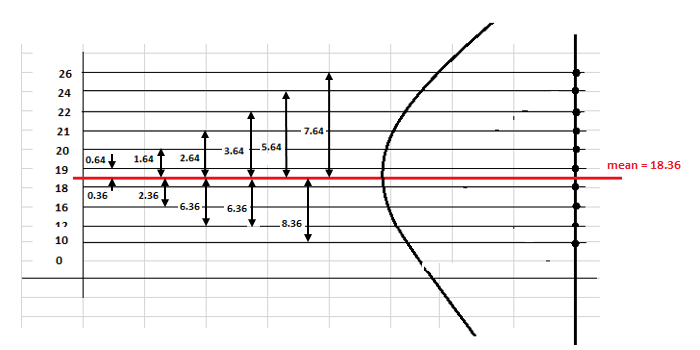
Standard deviation: When we do the square root of variance we get a standard deviation. This value of the standard deviation is the one standard deviation. The below image shows the steps to calculate the standard deviation.
In the below image the green shadow is the one standard deviation from the mean.
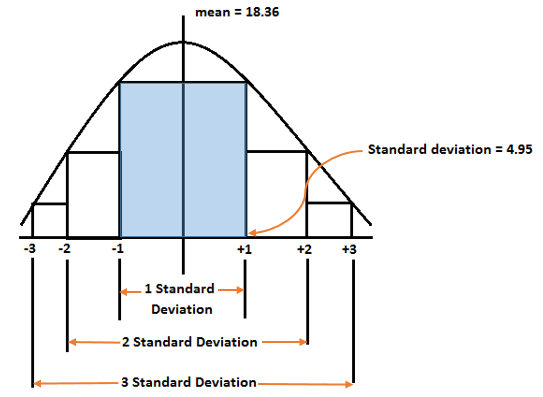
The 1 standard deviation consists of 68% of the data. The 2 standard deviations consist of 95% of the data. The 3 standard deviations consist of 99.7% of the data.
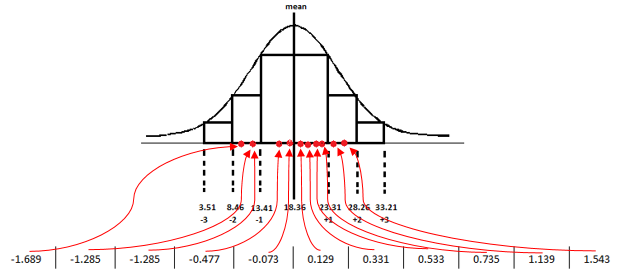
After finding the z-score of all the data we can draw the Standard deviation distribution.
The normal distribution curve with the spread of the data with their standard deviation value.
Application of z-score in Machine learning
- To standardize the data as a part of data pre-processing.
- To compare the z-score values of different standard distributions for better results.
Conclusion
This article will guide you through a brief introduction to the standard deviation distribution curve. Standard scaling is a crucial process in the data pre-processing of the machine learning algorithm.
I hope you like the article. Reach me on my LinkedIn and twitter.
Recommended Articles
1. 8 Active Learning Insights of Python Collection Module 2. NumPy: Linear Algebra on Images 3. Exception Handling Concepts in Python 4. Pandas: Dealing with Categorical Data 5. Hyper-parameters: RandomSeachCV and GridSearchCV in Machine Learning 6. Fully Explained Linear Regression with Python 7. Fully Explained Logistic Regression with Python 8. Data Distribution using Numpy with Python 9. Decision Trees vs. Random Forests in Machine Learning 10. Standardization in Data Preprocessing with Python


