
BUSINESS GIANTS
World’s 100 Biggest Companies in 2021
Visualizing the World’s biggest businesses by market capitalization, as well as the countries and sectors they are from
From time to time I have written about global businesses based on various metrics. In 2019, I covered the ones which were the most profitable, the largest by revenue, and the ones which paid the highest salary in the U.S. Then, last year, I wrote about the 100 most valuable brands, followed by the 100 most Sustainable companies in the World. Enough of the flashback, you get the point.
Moving on to today’s topic, we look at the Top 100 companies in the world. It is a little more worthwhile this year since the COVID-19 pandemic threw the global economy in a tailspin, the preceding March. The good thing is that many of the economies in different regions of the World are beginning to revive slowly, as we emerge from pandemic-driven lockdown.
Especially in the West, where governments handed out generous economic packages to help the business sector in the doldrums. Data for today’s infographic was taken from PricewaterhouseCoopers (PwC) — organizing the world’s biggest businesses by market capitalization, as well as the countries and sectors they are from.
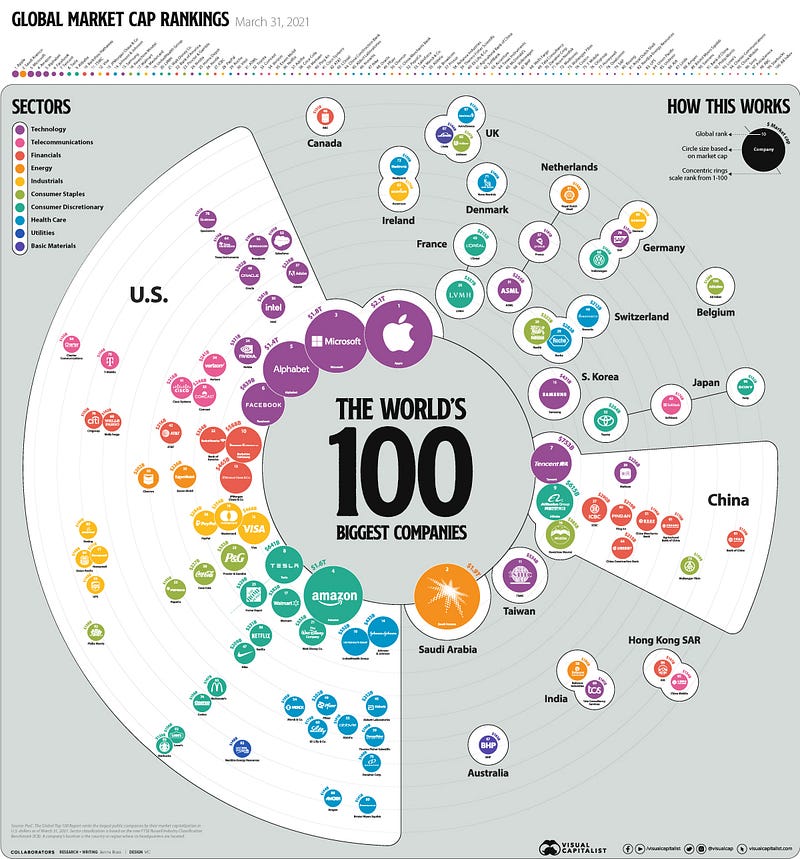
Before we move on to comb the data in a little more detail, here’s a quick comparison for you — The 100 biggest companies in the world were worth a record-breaking $31.7 trillion as of March 31, 2021, up 48% year-over-year. This massive number is just shy of the combined GDP of the two largest economies of the world, the U.S & China at $35.7 trillion in 2020.
Top 10 Companies
➊ Apple Inc. (United States, Technology, $2.1 trillion)
➋ Saudi Aramco (Saudi Arabia, Energy, $1.9 trillion)
➌ Microsoft Corp. (United States, Technology, $1.8 trillion)
➍ Amzon.com Inc. (United States, Consumer Discretionary, $1.6 trillion)
➎ Alphabet Inc. (United States, Technology, $1.4 trillion )
➏ Facebook Inc. (United States, Technology, $839 billion)
➐ Tencent (China, Technology, $753 billion)
➑ Tesla Inc. (United States, Consumer Discretionary, $641 billion)
➒ Alibaba Group (China, Consumer Discretionary, $615 billion)
➓ Berkshire Hathaway (United States, Financials, $588 billion)
Within the Top 10 companies, the United States dominates the ranking with seven of the ten businesses located in the country. Also, four out of the five members of the trillion-dollar club are from the U.S with Saudi Aramco being the only exception belonging to the Middle-eastern kingdom. The other two in the top list were from China. The technology sector dominated this list with 5 companies — the rest included 3 from consumer discretionary & one each from Financials & Energy sector.
Coming back to the overall ranking, one can see a wide disparity in value — case in point, Apple which sits at the top is worth over $2 trillion, 16x that of Anheuser-Busch (AB InBev), which took the 100th spot at $128 billion. Here are some of the other notable observations:
➤ The United States was once again the dominant player in the Top 100 ranking — with 59 companies headquartered in the country and also making up 65% of the top 100’s total market capitalization. China stole the №2 spot with 11 companies on the list.
➤ Rest of the countries represented on the list were like this — Japan, Germany, Netherlands, Switzerland, UK (3 each), France, Hong Kong, India, Ireland (2 each) & Saudi Arabia, Canada, Australia, Taiwan, Belgium, Denmark (1 each).
➤ When looking at the biggest gainers, the biggest success story was Tesla, which surged by an eye-popping 565% — making Elon Musk the richest person in the world, in the process. Food delivery platform Meituan & payments giant PayPal benefited from growing e-commerce popularity with their market capitalizations growing by 221% and 151% respectively. Tech companies TSMC and ASML Holdings were also among the top 10 risers — owing to chips shortage.
➤ On the losing side, Swiss companies Nestlé, Novartis, and Roche Holding were all among the bottom 10 companies by market capitalization growth. China Mobile was the only company to decline with a -12% change.
➤ Sectoral view revealed Technology sector having the highest market capitalization and was also the most common sector. Represented by 20 companies in the Top 100 list, the cumulative market cap came in at $10.5 trillion, representing 33.0% of the Top 100 market cap. Consumer discretionary & Financials came in at №2 (17 companies) & №3 (14 companies) respectively — their cumulative market cap was $6.0 trillion & 3.4 trillion in the same order.
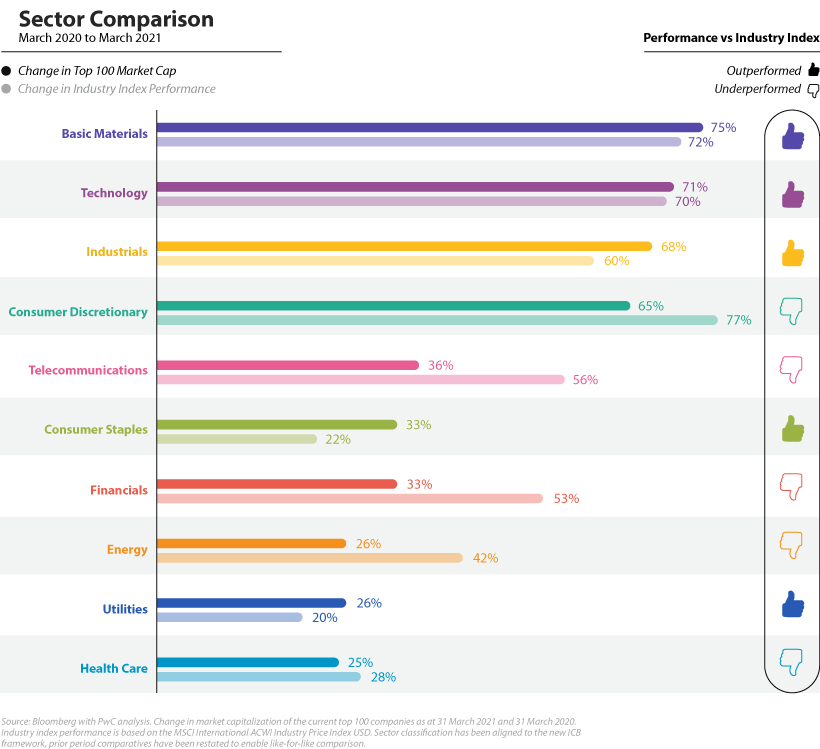
Almost all sectors have recovered and seen an increase in their market capitalization, owing to the massive fiscal stimulus & ultra-accommodative central bank policies. Having said that, some have fared better than others. Cyclical sectors like Basic materials and Industrials, along with Technology have outperformed their respective industry indexes. On the other hand, the worst-performing sectors in the top 100 were Health care, Utilities, and Energy.
It will be interesting to see how the business landscape changes as economies reopen completely.
