
World’s 100 Largest Companies by Revenue in 2019
Visualizing the Top companies making the most money
Companies across the globe have been reaping the profits from the solid economic growth of previous years. While these numbers may flatten or go down as we see the recessionary effects of the trade war filter through, current profitability numbers of these companies depict they are in good shape to stave off an economic downturn.
The Revenue data for the Top 100 companies in the visualization below was gathered from Fortune list of Global 500 companies, which is published every year. You can find the details of the criteria used for Global 500 here.
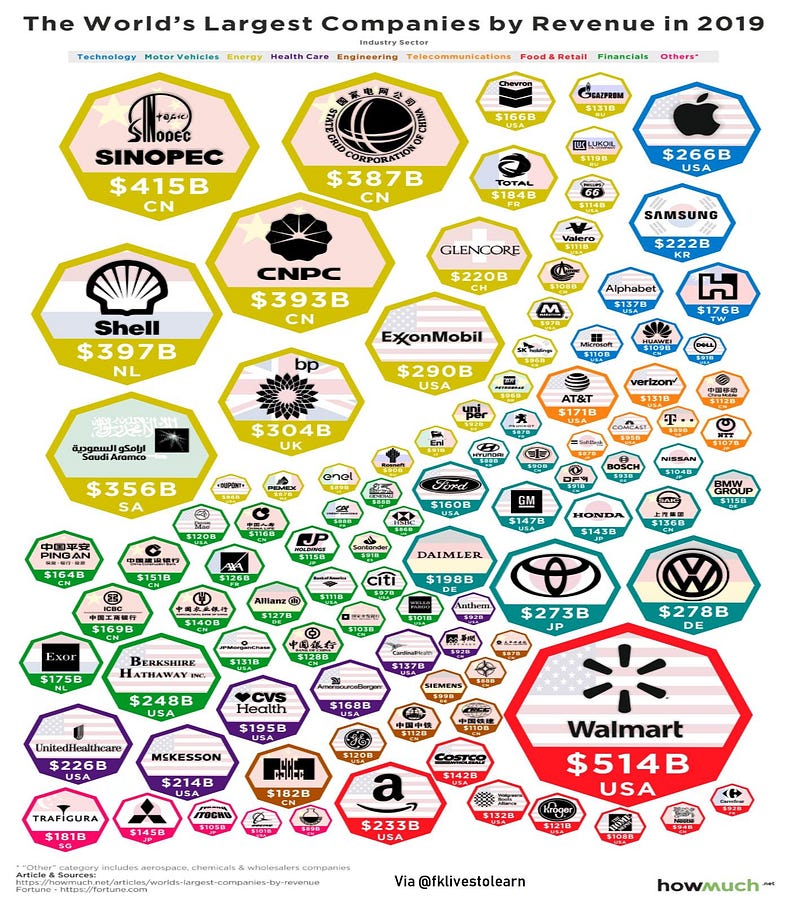
Each octagon in the infographic represents a company with a shape size proportional to its revenue, color-coded to represent the sector it belongs to, with the total revenue reported at the bottom. Every company octagon also lists the name of the country to which the company belongs.
Let’s look at some of the key takeaways from the Report.
⯃ The combined revenue of the Top 100 companies amounted to more than $15 trillion.
⯃ 17 Countries were represented in the Top 100 companies.
⯃ 58 companies in the Top 100 Club came from the U.S (35) & China (23) alone.
⯃ Although the companies were spread across many different industries, the biggest ones came from the energy sector.
⯃ Walmart topped as the biggest revenue-generating company with a figure of $514 billion.
⯃ Although Tech companies have grown really big in the past decade, the top revenue-generating in this sector was Apple at Number 11 with $266 billion followed by Samsung with $222 billion.
⯃ The Top 10 club was dominated the Energy sector as well — with seven of the ten from the energy sector, two from automotive & one from Retail.
Below is the list of the Top 10 companies with their revenue valuations, the country they belong to, with the profit percentage & the number of employees in the brackets and position change from last year in the end.
- Walmart, U.S. — $514 billion (-32.4%, 2,200,000) no change
- Sinopec Group, China — $415 billion (280.1%, 619,151) +1
- Royal Dutch Shell, Netherlands — $397 billion (79.9%, 81,000) +2
- China National Petroleum, China — $393 billion (n/a, 1,382,401)
- State Grid, China — $387 billion (-14.3%, 917,717) -3
- Saudi Aramco, Saudi Arabia — $356 billion (46.9%, 76,418) no change
- BP, Britain — $304 billion (176.9%, 73,000) +1
- Exxon Mobil, U.S. — $290 billion (5.7%, 71,000) +1
- Volkswagen, Germany — $278 billion (9.3%, 664,496) -2
- Toyota Motor, Japan — $273 billion (-24.6%, 370,870) -4
According to Forbes, Global 500 companies saw a revenue increase of 9% over the previous year. American companies were the main contributors to this improvement owing to the lowered corporate taxes by the government.
However, the analysts are also predicting lower profit margins for American companies going forward owing to high costs of labor & raw materials and more importantly, to the international tariffs being imposed as a result of the trade war.
Policy developments in the U.S and the rest of the World are going to have a major impact on the revenue generation capacity & profitability of the companies.