
World Map Data Visualization with d3.js, GeoJSON and SVG-zooming and panning and dragging
In several recent articles on Data Visualization using a Thematic World Map with color shades assigned to countries based on their value for a specific property in a world data set I have introduced the use of d3.js library for browser based visualization using SVG in combination with the GeoJSON data format in which many geographical definitions are available, from countries and states to cities, lakes and forests. I have shown how we can easily make the map switch between different properties and how we can add some degree of interactivity (allowing countries to be selected by clicking on them and changing the rotation or horizontal / east-west translation of the map.
In this article we will continue on with interactivity. We will discuss zooming in (and then out again) in two different ways: programmatically and user initiated. We will also discuss panning (or dragging) the map (when it is larger than the view box through which we look at it. Panning in d3 is a part of zooming and we get it more or less for free.
The final topic in this article is: zooming in on all selected countries — adjusting the zoom and translation whenever the selection changes.
User Initiated Zooming and Panning
D3 comes with rich support for zooming and panning (dragging, translating) SVG elements. It is clear that users have come to expect that graphs can be moved around and zoomed in upon — to the extent that I find myself sometimes making stretching and pinching finger movements on chart in the newspaper or some magazine.
In order to make the world map zoomable. we have to do a few simple things:
- define a zoom behavior — a simple object that defines what should happen when the zoom event occurs; part of this behavior are the definition of the maximum and minimum zoom factor (how large of small can the map become) and how far the translation of the map can be done (aka how far the user can drag the map around)
- attach the zoom behavior in such a way that every object (and every pixel) you want the user to be able to zoom on and drag with is enabled
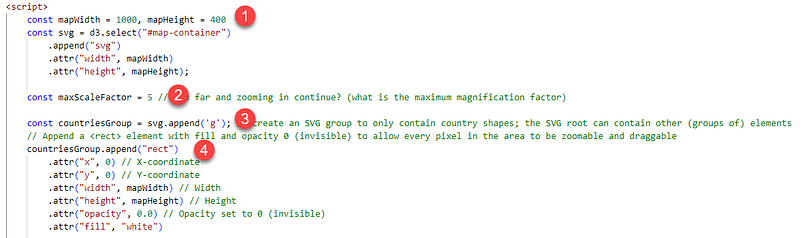
In comparison to the code discussed in the earlier articles, I have now defined the height and width of the map using constants (1). I have also defined the maximum scaling factor (2): given the resolution of the GeoJSON data it does not make sense to allow users to zoom beyond factor 5.
I make use of a trick to ensure all pixels in the map are zoom-enabled: I create a group (3) that contains all country shapes and also an invisible rectangle. The zoom behavior will be associated with the group (and be inherited by all its children). However, a group is not represented by pixels. That where the invisible rectangle comes in (4): it makes sure that every pixel on the screen is part of an actual SVG object that has zoom behavior.
 const mapWidth = 1000, mapHeight = 400
 const svg = d3.select("#map-container")
                .append("svg")
                .attr("width", mapWidth)
                .attr("height", mapHeight);

 const maxScaleFactor = 5 // how far and zooming in continue? (what is the maximum magnification factor)

 const countriesGroup = svg.append('g'); // create an SVG group to only contain country shapes; the SVG root can contain other (groups of) elements
 // Append a <rect> element with fill and opacity 0 (invisible) to allow every pixel in the area to be zoomable and draggable
 countriesGroup.append("rect")
                .attr("x", 0) // X-coordinate
                .attr("y", 0) // Y-coordinate
                .attr("width", mapWidth) // Width
                .attr("height", mapHeight) // Height
                .attr("opacity", 0.0) // Opacity set to 0 (invisible)
                .attr("fill", "white")
With this set up in place, adding the zoom behavior is quite straightforward.
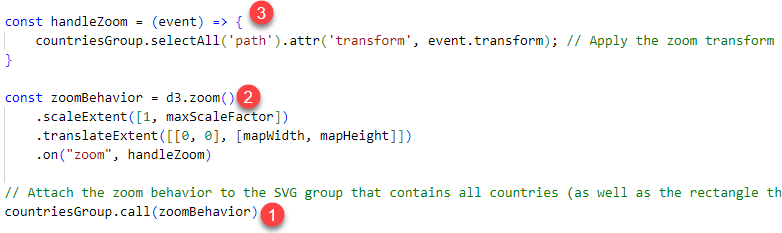
- the zoomBehavior is associated with the countriesGroup
- the zoomBehavior is defined, using 1..maxScaleFactor as the zoom range and 0,0 to mapWidth, mapHeight as the translation (or panning/fragging) range (the latter means that the entire area between 0,0 and mapWidth, mapHeight will always be covered with a bit of map. When the zoom event occurs, function handleZoom is to be invoked
- Function handleZoom will simply apply the transformation associated with the zoom event (a combination of scale and translate) to all path elements in the countriesGroup (the shapes of all countries). Note: this is where you can implement funny things like a country that does not participate in zooming)
const handleZoom = (event) => {
countriesGroup.selectAll('path').attr('transform', event.transform); // Apply the zoom transform to path elements in countriesGroup (i.e. the country shapes)
}
const zoomBehavior = d3.zoom()
.scaleExtent([1, maxScaleFactor])
.translateExtent([[0, 0], [mapWidth, mapHeight]])
.on("zoom", handleZoom)
// Attach the zoom behavior to the SVG group that contains all countries (as well as the rectangle that makes sure even every pixel not in a country shape is zoom=enabled)
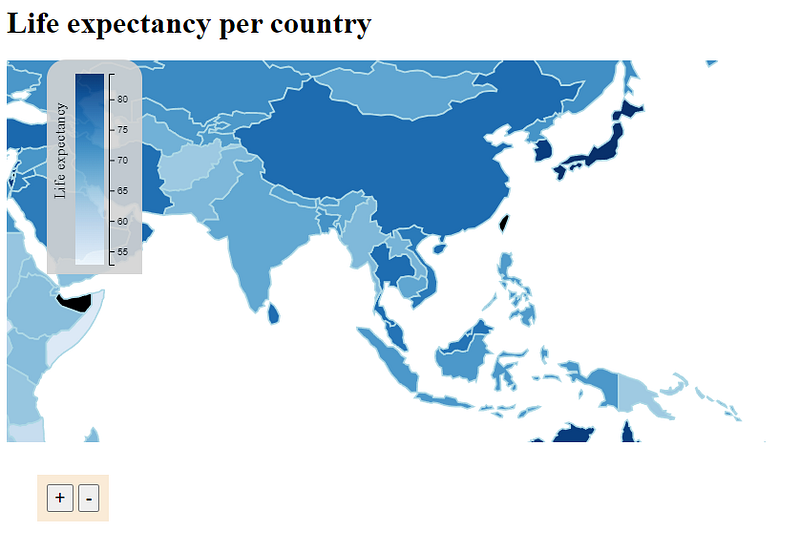
countriesGroup.call(zoomBehavior)After zooming and panning, the map could present for example this focus view on South Asia:
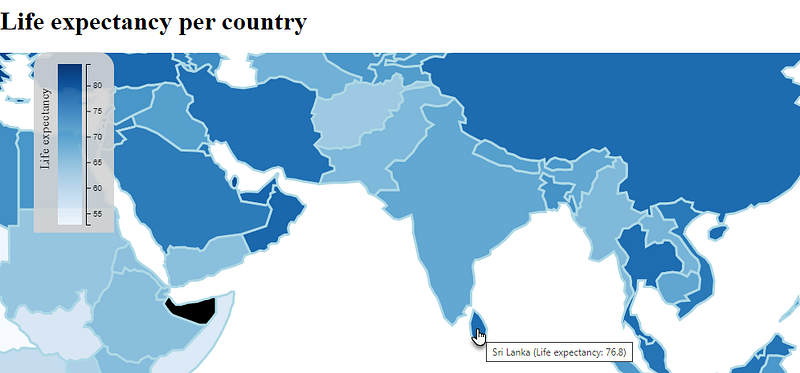
Note that the legend is not enlarged, nor is the H1 title element. Zoom only applied to the countriesGroup element and all is children.
Country selection and associated styling is included in zooming.
The highlighted borders are as much thicker as the map is larger. We could consider applying different CSS styles — with differing stroke-width values — for different zoom factors.
The current state of the index.html. A live demo of this functionality.
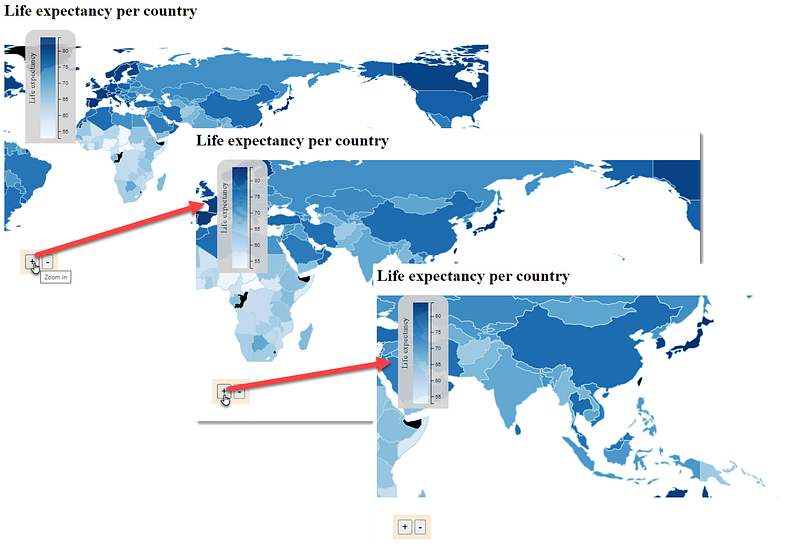
Programmatic Zoom — Buttons for zooming in and out
In addition to zooming and panning through the built in zoom event that is triggered by a user’s actions, we can also cause zoom (and translate) in a programmatic way. As a simple example, let’s add zoom-controls — buttons that allow zooming in and out (respecting the zoom range from 1..5.
This will look like this:
The code for this:
.zoom-box {
    position: absolute;
    top: 500px;
    left: 40px;
    background-color: antiquewhite;
    padding: 10;
}

.zoom-panel {
    font-size: 20px;
}
  </style>
</head>

<body>
  <h1>Life expectancy per country</h1>
  <div id="map-container"></div>
  <div id="legendBox" class="legend-box">
  </div>
  <div class="zoom-box">
    <div id="zoompanel" class="zoom-panel">
      <button onclick="zoomIn()" class="zoom-panel" title="Zoom In">+</button>
      <button onclick="zoomOut()" class="zoom-panel" title="Zoom Out">-</button>
      <button onclick="reset()" class="zoom-panel" title="Reset">Reset</button>
    </div>
And when the button has been clicked upon twice:
The functions zoomIn() and zoomOut() that make the actual zoom happen are as simple as can be:
const zoomOut = () => {
    countriesGroup
        .transition()
        .call(zoomBehavior.scaleBy, 0.667);
}
const zoomIn = () => {
    countriesGroup
        .transition()
        .call(zoomBehavior.scaleBy, 1.5);
}
They make use of the zoomBehavior we defined earlier on and apply a transition to it, multiplying the existing scale factor with either 0.667 (zoom out) or 1.5 (zoom in). The zoomBehavior knows it can not scale beyond 5 or below 1 and it respects those boundaries.
Similar to programmatic zooming is panning. Using the zoomBehavior, we can easily move around our viewpoint of the map within the constraints set by the translate extent. Here I have added four buttons to move our vantage point over the map.
The code for creating these four buttons:
<div class="zoom-box">
  <div id="zoompanel" class="zoom-panel">
      <button onclick="zoomIn()" class="zoom-panel" title="Zoom In">+</button>
      <button onclick="zoomOut()" class="zoom-panel" title="Zoom Out">-</button>
      <button onclick="reset()" class="zoom-panel" title="Reset">Reset</button>
  </div>
  <br />
  <div id="translatepanel" class="zoom-panel">
      <button onclick="panMap('left')" class="zoom-panel" title="Translate Left"><-</button>
      <button onclick="panMap('up')" class="zoom-panel" title="Translate Up">^</button>
      <button onclick="panMap('down')" class="zoom-panel" title="Translate Down">v</button>
      <button onclick="panMap('right')" class="zoom-panel" title="Translate Right">-></button>
  </div>
</div>
The code for function panMap():
const panMap = (direction) => {
    const panStep=50
    let horizontal = direction=="left"? panStep : (direction=="right"? -panStep:0)
    let vertical = direction=="up"? panStep : (direction=="down"? -panStep:0)
    countriesGroup
        .transition()
        .call(zoomBehavior.translateBy, horizontal, vertical);
}
The translateBy function on the zoom behavior calculates the new transform from the current one combined with the translation of the horizontal and vertical distances (one of which is always 0). This function respects the translate extent that was defined on the zoomBehavior.
Note: to reset the zoom and translation — and return the map to how it looked before we did any zooming and panning — we can invoke function reset():
const reset = () => {
    countriesGroup
        .transition().duration(800)
        .call(zoomBehavior.translateTo, 0, 0)
        .call(zoomBehavior.scaleTo, 1);
}
The duration(800) call takes care of turning the transition from the current scale factor and translation back to the beginning into a smooth animation that lasts for 800 ms.
The status of the index.html at this point. A live demo of the world map application.
Zoom In on Selected Countries
A special form of programmatic zoom action is the following: when a user selects a country, zoom in on that country (shape). When multiple countries are selected, zoom in on all the country shapes;. And when a country is deselected, adjust the zoom accordingly.
This zoom is triggered whenever countries are selected and deselected, And it must take into account the rectangle that fully encloses the selected country or countries. The center of this rectangle defines the required translation target. And the size of that rectangle relative to the total map viewbox size determines the appropriate scale factor.
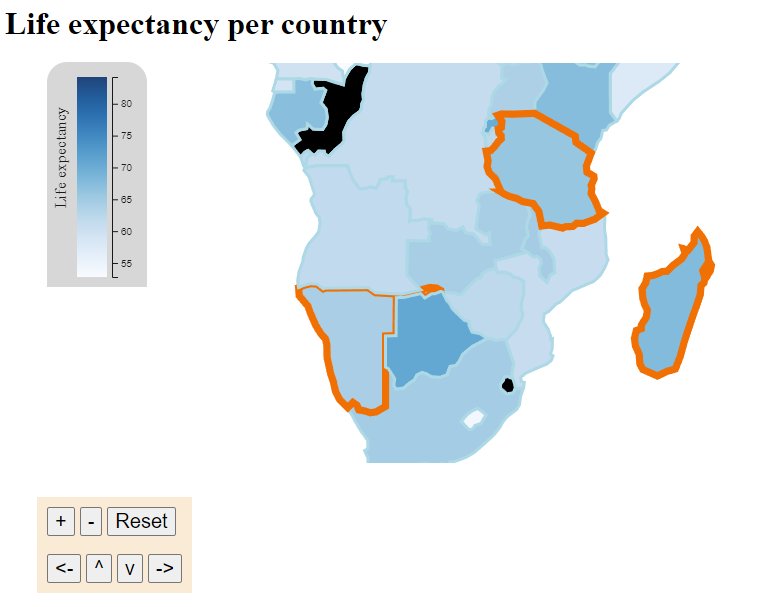
For example, with Namibia, Tanzania and Madagascar selected, the automatic zoom we want to implement should bring the area indicated by the rectangle in the next figure into focus.
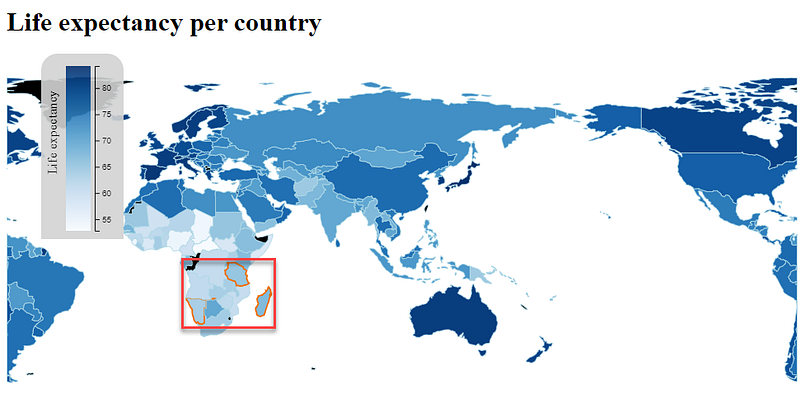
After we are done with this particular feature, the map is zoomed in like this:
The following code will zoom (pan and scale) the map based on the selected countries:
- find all GeoJSON features for the currently selected countries
- process all features and find the lowest and highest X and Y coordinate for any of them; the bounds function on geoGenerator returns the four extremes (min and max for X and Y) for the corners of the rectangle that fully encloses the shape
- determine the scale factor: how much smaller than the entire map is the enclosing rectangle? I have decided that the scale factor cannot be larger than 4.
- construct a transform that first translates to the center, then applies the new scale factor and finally translates to the center of the rectangle
- apply the transformation to the countriesGroup
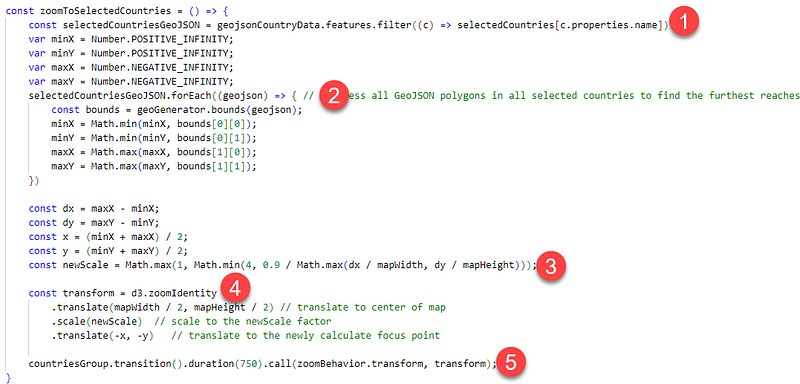
const zoomToSelectedCountries = () => {
const selectedCountriesGeoJSON = geojsonCountryData.features.filter((c) => selectedCountries[c.properties.name])
var minX = Number.POSITIVE_INFINITY;
var minY = Number.POSITIVE_INFINITY;
var maxX = Number.NEGATIVE_INFINITY;
var maxY = Number.NEGATIVE_INFINITY;
selectedCountriesGeoJSON.forEach((geojson) => { // [process all GeoJSON polygons in all selected countries to find
const bounds = geoGenerator.bounds(geojson);
minX = Math.min(minX, bounds[0][0]);
minY = Math.min(minY, bounds[0][1]);
maxX = Math.max(maxX, bounds[1][0]);
maxY = Math.max(maxY, bounds[1][1]);
})
const dx = maxX - minX;
const dy = maxY - minY;
const x = (minX + maxX) / 2;
const y = (minY + maxY) / 2;
const newScale = Math.max(1, Math.min(4, 0.9 / Math.max(dx / mapWidth, dy / mapHeight)));
const transform = d3.zoomIdentity
.translate(mapWidth / 2, mapHeight / 2) // translate to center of map
.scale(newScale) // scale to the newScale factor
.translate(-x, -y) // translate to the newly calculate focus point
countriesGroup.transition().duration(750).call(zoomBehavior.transform, transform);
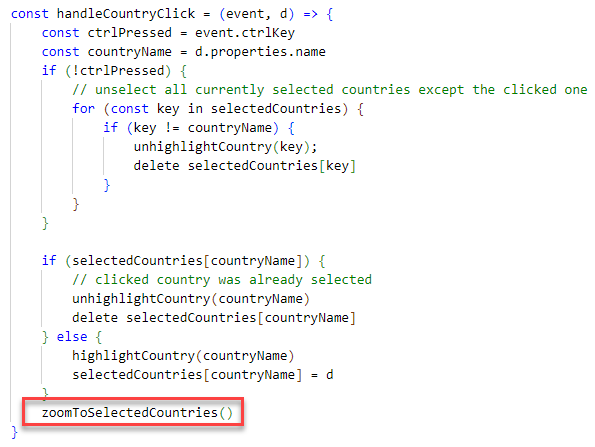
}This function is to be invoked whenever the selection of countries changes. All such changes are currently taken care of by function handleCountryClick, so that is where zoomToSelectedCountries should be invoked:
The status of the index.html at this point. A live demo of the world map web application.
Conclusion
In this article I have leveraged the rich support for zooming and panning in D3.js. The articles describes both user initiated zooming and panning as well as programmatic zooming and panning. By adding transitions to the transformations, we can provide the user with smooth animations that make the step between two states easier to absorb.
Resources
GitHub Repository with the code for this article.
My earlier articles on World Map data visualization:
1. Create Interactive World Map to Visualize Country Data — https://readmedium.com/create-interactive-world-map-to-visualize-country-data-baa5b242bfbb — introducing World Map Data Visualization with d3, SVG and JavaScript.
2. Presenting the World in Data using World Map Visualization — https://readmedium.com/presenting-the-world-in-data-using-world-map-visualization-d3-kaggle-world-data-set-7c16ca207fb0— bring together a straightforward approach to data visualization (from article one) and a rich data set from Kaggle that provides many interesting details for all countries in the world, related to education, health, economy, demography, climate and more.
3. Interactive Data Visualization in World Map-Zoom, Translate, Legend — https://readmedium.com/interactive-data-visualization-in-world-map-translate-select-legend-popup-4d28261110df — a closer look at adding some interactivity to the world map. In particular: changing the rotation of the map, select countries (by clicking on them), show country details popup window and show legend — color scale (mapping heatmap colors to numerical values)
Follow up:
5. Map Visualization of (office locations in) The Netherlands -using GeoJSON, D3 and SVG — https://readmedium.com/map-visualization-of-office-locations-in-the-netherlands-using-geojson-d3-and-svg-62ce923d747d — find a GeoJSON file with data for the 12 provinces in The Netherlands and visualize the country with its provinces using d3.js in a simple web application. Then add a custom GeoJSON file with locations of my choosing and draw markers on the map for these locations.
Originally published at https://technology.amis.nl on January 1, 2024.