
Presenting the World in Data using World Map Visualization — D3 & Kaggle World Data Set
This article is a sequel to my introduction into World Map visualization (using d3, SVG and JavaScript). The previous article introduced the visualization of country specific data on a world map — using colors (to represent where on a heatmap scale a country ranks) and a popup (title property) to provide details on the country the cursor is hovering over.
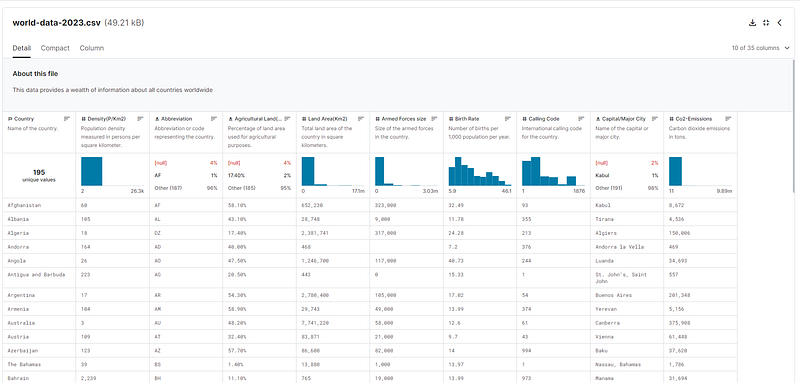
In this article, we bring together this straightforward approach to data visualization and a rich data set from Kaggle that provides many interesting details for all countries in the world. This data set can be inspected on and downloaded from Kaggle.
It contains properties related to education, health, economy, demography, climate and more.
My objective in this article:
- retrieve the data set in the web application
- enrich the GeoJSON data for countries (that describe their shape in long/lat coordinates) with the data from this data set
- create a selection element through which the user can select the property she wants to have visualized in the world map; when a property is selected, colors of all countries need to be adjusted — based on the new color scale derived from the minimum and maximum value among all countries for the selected property — and the content of the popup text (hover bubble) should indicate the value of the selected property for the country
As I had hoped, this turns out not all to be very difficult.
Step 1: Fetching & Parsing Data Set
I download the data set from Kaggle and I add to my GitHub repo — after making a full small changes (for example remove $ character in amounts, remove spurious space character, add country codes for North Macedonia and Ireland). Now I can retrieve the data set at runtime using a single line:
fetch(worldDataUrl)(where worldDataUrl is a constant that refers to the location of the data set in my GitHub repo — https://raw.githubusercontent.com/lucasjellema/worldmap-visualization-part-two/main/world-data-2023.csv)
Actually, before I can use this CSV formatted data set, I need to parse it into JavaScript objects. This is easily done using PapaParse library. This library is imported using this statement
<script src=”https://cdnjs.cloudflare.com/ajax/libs/PapaParse/5.3.0/papaparse.min.js"></script>The actual fetching and loading:
const parseCSV = (csvString) => {
return new Promise((resolve, reject) => {
 Papa.parse(csvString, {
 complete: results => resolve(results.data),
 error: error => reject(error),
 header: true // if your CSV has headers; set to false otherwise|
 });
 });
 }

fetch(worldDataUrl).then(response => response.text().then(csvString => parseCSV(csvString))).then( // start processing parse result)
Step 2: Enrich Country GeoJSON with Country Data
Both the GeoJSON data and the Kaggle Country Data Set are fetched in asynchronous calls. When both calls are complete, we can enrich the objects in the GeoJSON data set — that we use to generate the SVG shapes that represent the countries — with the properties we learn from the Kaggle Data Set.
Promise.all combines the two asynchronous calls and only when both promises have resolved will the code continue. The worldDataRecords object is an Array with objects per country; the names of the properties of these country objects correspond to the headers in the first lines in the CSV file.
We create countryDataMap as an object with properties equal to country abbreviations and values equal to the country data records that have been parsed from the Kaggle CSV file. We will use this object (a map or dictionary) to easily retrieve the object to use for enriching each of the GeoJSON features elements.
The geojsonData.features array is iterated with forEach. In each element, we add properties from the corresponding country object.
Promise.all([
            d3.json(geojsonUrl),
            fetch(worldDataUrl).then(response => response.text().then(csvString => parseCSV(csvString)))
        ])
            .then(([geojsonData, worldDataRecords]) => {
                // Both promises have resolved
                // geojsonData is the result of d3.json
                // worldDataRecords is the result of fetch and papa parse
                // bring data from worldDataRecords and geojsonData together
                const countryDataMap = {}
                for (const country of worldDataRecords) {
                    countryDataMap[country.Abbreviation] = country
                }
                geojsonData.features.forEach((d) => {
                    const countryCode = d.properties.iso_a2;
                    const country = countryDataMap[countryCode]
                    if (country) {
                        // copy properties from country record to d.properties
                        for (let key in country ) {
                            if (key !== 'Country') {
                                d.properties[key] = country[key];
                            }
                        }
                    }
                })
Step 3: Allow Selection of Property to Visualize in World Map
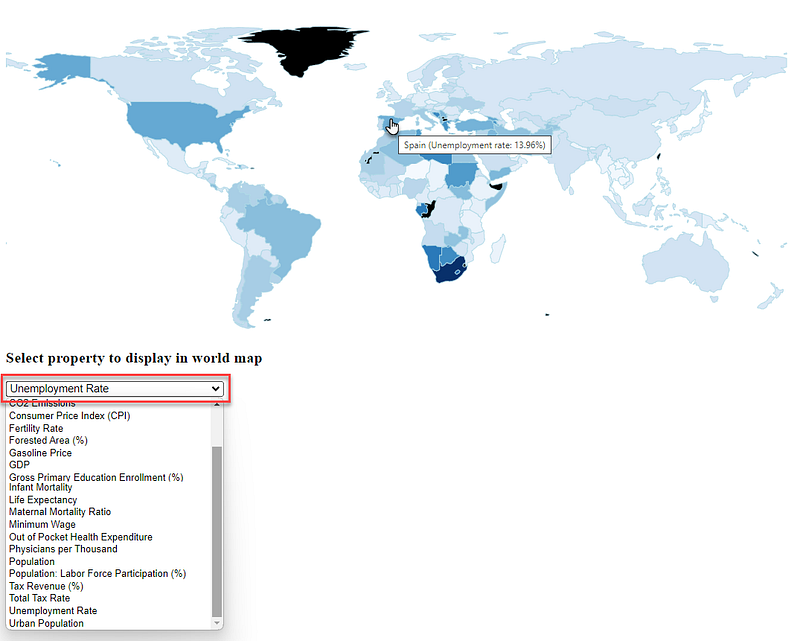
A
    <h3>Select property to display in world map</h3>
    <select id="dataOptions" name="dataOptions" onchange="displayProperty(this.value)">>
        <option value="Birth Rate">Birth Rate</option>
        <option value="Agricultural Land( %)">Agricultural Land (%)</option>
        <option value="Land Area(Km2)">Land Area (Km²)</option>
        <option value="Armed Forces size">Armed Forces Size</option>
        <option value="Co2-Emissions">CO2 Emissions</option>
        <option value="CPI">Consumer Price Index (CPI)</option>
        <option value="Fertility Rate">Fertility Rate</option>
        <option value="Forested Area (%)">Forested Area (%)</option>
        <option value="Gasoline Price">Gasoline Price</option>
        <option value="GDP">GDP</option>
        <option value="Gross primary education enrollment (%)">Gross Primary Education Enrollment (%)</option>
        <option value="Gross tertiary education enrollment (%)">Gross Tertiary Education Enrollment (%)</option>
        <option value="Infant mortality">Infant Mortality</option>
        <option value="Life expectancy">Life Expectancy</option>
        <option value="Maternal mortality ratio">Maternal Mortality Ratio</option>
        <option value="Minimum wage">Minimum Wage</option>
        <option value="Out of pocket health expenditure">Out of Pocket Health Expenditure</option>
        <option value="Physicians per thousand">Physicians per Thousand</option>
        <option value="Population">Population</option>
        <option value="Population: Labor force participation (%)">Population: Labor Force Participation (%)</option>
        <option value="Tax revenue (%)">Tax Revenue (%)</option>
        <option value="Total tax rate">Total Tax Rate</option>
        <option value="Unemployment rate">Unemployment Rate</option>
        <option value="Urban_population">Urban Population</option>
    </select>
When the user changes the selection value to have a different property visualized in the world map, the onchange trigger fires and the function displayProperty is invoked with the exact name of the property — from the Kaggle csv file, now added to the each GeoJSONs features element — that should be visualized.
Because all country shaped have been initialized as SVG path elements when the application first loaded, we now need to do fairly little: determine a new color scale and re-calculate the color for each country based on the its value for the selected property and this new color scale.
Function displayProperty uses d3.extent to determine the domain (minimum and maximum value among all countries) for the selected property. A corresponding colorScale is created — for that domain. Finally, all path elements under the svg object — these are the country shapes that were created earlier on — are visited and the fill color as well as the title property is revisited for each of them. The new color scale is used to derive the color for the country’s value of the selected property. The hover text is redefined — using the name and value of the selected property.
const displayProperty = (property) => {
const propertyDomain = d3.extent(geojsonCountryData.features, (d) => parseFloat(d.properties[property]))
const colorScale = d3.scaleSequential(d3.interpolateBlues).domain(propertyDomain)
svg
.selectAll('path')
.data(geojsonCountryData.features)
.style('fill', (d) => colorScale(parseFloat(d.properties[property])))
.attr('class', 'country')
.select('title')
.text(
(d) => `${d.properties.name} (${property}: ${d.properties[property]})`)
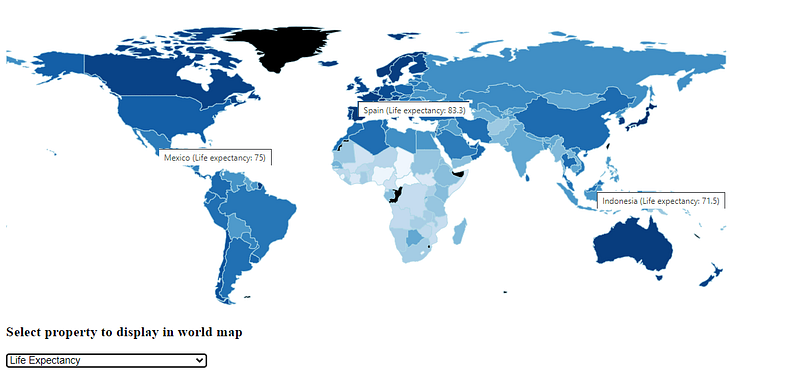
}The result:
A different property can be selected and the world map is updated instantaneously to reflect the values per country of the newly selected property:
Check out this live demo of the application .
This article does not aim to provide a thorough analysis of the world. It does want to present a nice way to present relevant data on a country by country basis in an attractive and accessible manner. The overall code size to implement this functionality is almost ridiculously small. Thanks to the work of many people, including Nidula Elgiriyewithana who put together the Kaggle Data Set and Mike Bostock who created d3 and provided rich documentation for making good use of it.
Sequel: on rotation, selection, legend and popup
I have written a follow up article that discusses how the map can be rotated, how countries can be made selectable, how a legend can be presented to map colors to values and how a popup window can display information for a selected country: Interactive Data Visualization in World Map — Translate, Select, Legend, Popup
Resources
GitHub Repo for this article: https://github.com/lucasjellema/worldmap-visualization-part-two . Live demo of the application described in this article.
Previous article, introducing World Map Data Visualization with d3, SVG and JavaScript: https://technology.amis.nl/frontend/web-html5-css3/create-interactive-world-map-to-visualize-country-data/
Kaggle Data Set Global Country Information Dataset 2023 — https://www.kaggle.com/datasets/nelgiriyewithana/countries-of-the-world-2023/data (by Nidula Elgiriyewithana)
Originally published at https://technology.amis.nl on December 30, 2023.