
Archived Story #1
This is an archived story by Adam Parsons.
This story is archived because the content was poorly written by me and used by some readers to fan the flames of class warfare. For a full explanation, please see this article. (include link)
Original title: Why the Middle Class Hates the Poor
Original subtitle: …and the Rich Hate Everyone.
One of the main ways to fund both of President Biden’s signature plans, the American Jobs Plan and the American Families Plan, is to raise taxes on the wealthiest Americans, both by increasing the top income tax bracket and almost doubling the capital gains tax.
There has been a lot of talk about ensuring the rich pay their fair share, and I wanted to see if they are really ducking taxes or actually paying their share or more.
As it turns out, this question had already been answered quite extensively by the Tax Foundation, Pew Research, and the Congressional Budget Office.
The short answer is yes, the rich do pay their fair share. They pay taxes at a higher rate than the lower brackets, and they contribute the most tax money per capita to the federal budget.
While the tax brackets and other tax laws change over the years, this has been the status quo for decades.
So what now?
As I was crunching some numbers, something interesting caught my eye.
A Problem with the Tax Structure
Below is the 2021 update of federal income tax data, using the 2018 tax year.
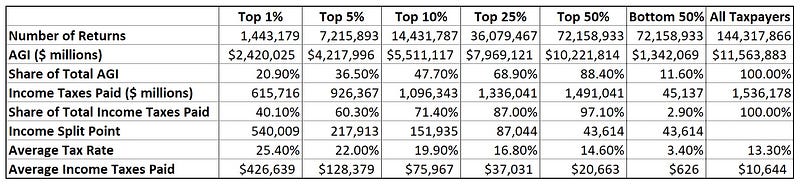
Some quick takeaways include:
- The top 1% of earners paid 40% of all income taxes.
- The top 50% of earners paid 97% of all income taxes.
- It takes $540,000 of income to crack the 1%.
- The data shows evidence of the progressive nature of our tax system.
The flaw with this data is that the groups are inclusive. For example, the data for the Top 10% includes both the Top 5% and the Top 1%. It’s an ever growing slice of the pie and doesn’t actually compare the groups, outside of the top and bottom halves.
Below is the table, but parsed for the individual groups.
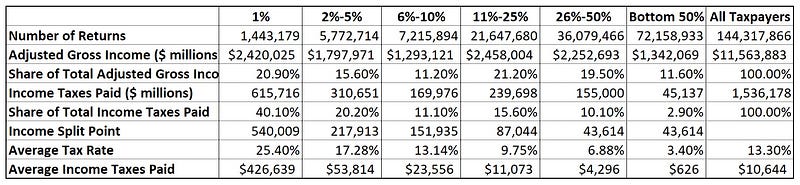
This gives us a much clearer picture of what happens with both income and taxes as you move up the income chain.
Reviewing this table, we see the following:
- The 26%-50% has an income range of $43,614 — $87,044. That’s a good enough definition of “middle class”.
- The middle class only pays an effective tax rate of 7%.
- The progressive model is much clearer in this parsed data.
The Origin of the Middle Class Resenting the Poor…
When moving up the socioeconomic ladder, while we have a goal to get as high as possible, we most often look at where we just were (one group lower) and were we are going next (one group higher).
Below is a comparison of each group to the one below it.
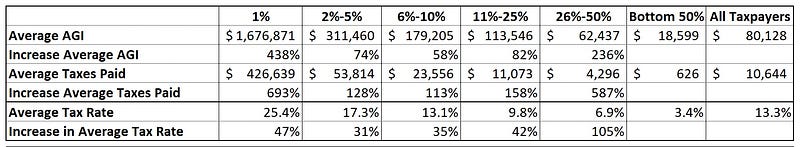
Looking at the bottom line, we can see that tax rates increase at about 40%, give or take, for all the income brackets as we move up.
Except, that is, when moving from the Bottom 50% to the 26%-50% bracket. In that move, your tax rate increases 105%.
And financially that might make sense, given that you are hopefully above the poverty line and moving on up in life. But psychologically, it’s a knockout punch, building resentment to those who earn far less.
Digging deeper, we can see the more insidious reasons for that resentment. While income increases 236% in that move, your tax burden increases 587%. And that’s the arrow that pierces your heart and turns it to stone.
…and of the Rich Resenting Everyone
Taking a second look at the data above, we can see the progressive increases in taxes, with income increasing in double digits but taxes increasing in triple digits. But the ratio is about the same as the prior bracket.
That is, until we hit the highest tax bracket of the 1%.
Once you get there, your income increases 438% but your tax burden increases by 693% compared to the cohort immediately below you.
While the rich may be earning a ton of money, that increase just flat out hurts the mind, no matter how high your income.
The Takeaway
It’s easy to vilify the rich as fat cats lounging on their million dollar yacht, and as the poor as just moochers feeding off the system, while the rest of us do the heavy lifting.
The numbers are hard to grasp, and the 24/7 talking heads just fan the flames of that disparity. But at the end of the day, the tax system is mostly working. We just need to optimize it as best we can.
Most Recent Stories
- What’s Going on With Biden’s Capital Gains Tax?
- Your Super Cheap Health Care Deductible Is Too Expensive
- Will Student Loan Forgiveness Actually Work?
- My Worst Financial Mistake
- The Anti-Debt Fanatics Are Wrong
This article is for informational purposes only and should not be considered Financial or Legal Advice. Not all information may be accurate. Consult a financial professional before making any major financial decisions.


