

Visualizing the first decline in Global Wealth & HNWIs since 2011
5 Charts showing the Declining wealth trends in 2018 after seven years of growth
Following a slump in Global Equities in late 2018 and the subsequent slow down in the Global Economy, 2018 was marked by a decline in global wealth & HNWI (High Net Worth Individual) population after a steady increase of prior seven years (2011–2017). Some of the key findings of Capgemini’s latest World Wealth Report were as follows:
❏ The Asia-Pacific — the global powerhouse region, which hosts most of the emerging economies was the biggest driver of this decline. China alone accounted for 25% of global wealth decline, followed by a noticeable dip in Europe as well.
❏ The region of the Middle East acted as the lone star & the only exception, where HNWI Wealth & Population both grew contrary to the general trend.
❏ North America’s numbers hugged the flat-line while Latin America showed mixed performance.
❏ The ultra-HNWIs (who represent 1% of the HNWI population) accounted for almost 75% of global wealth decline, mainly due to their broad exposure to Equities.
❏ The report concludes that global economic recovery remains shrouded in uncertainty with brewing trade wars & growing geopolitical tensions.
Combing the report, I isolated a few charts which give us some interesting insights into the global wealth & economic decline in 2018.
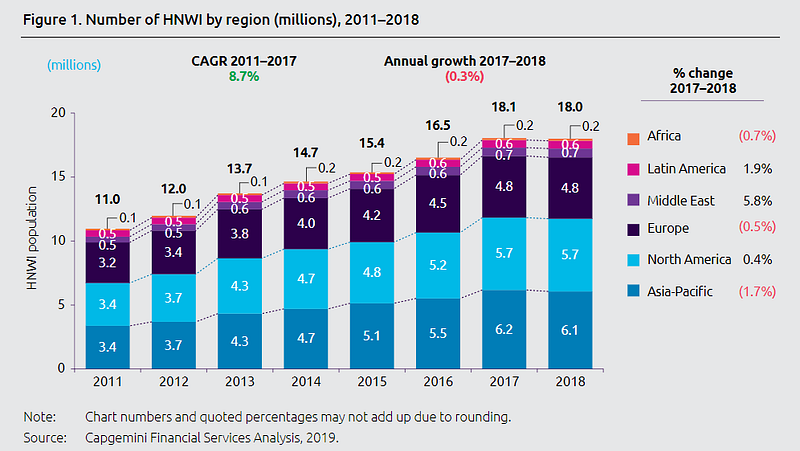
The number of HNWIs increased in three regions, but the gains were offset by a decline in the other three (Figure 1). The Asia Pacific saw the biggest drop of -1.7%, while the Middle East came as a savior with a gain of 5.8%. As stated before, the drop was largely attributed to the broad-based losses in Global Equities. The global HNWI population remained steady however, at 18 million, a small drop from 18.1 million the year earlier.
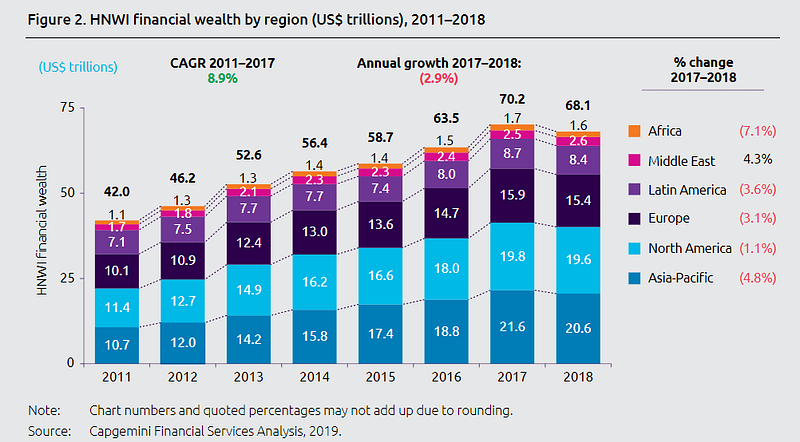
The Compound annual growth rate (CAGR) of 8.9% over the seven-year period (2011–2017) was halted by a drop of -2.9% in 2017–18 (Figure 2). Five out of the six regions reported cumulative wealth losses amounting to a total of $2.1 trillion. China & Europe accounted for 25% & 24% wealth decline respectively. The loss of wealth by Chinese millionaires was on account of a 20% decline in the domestic stock market and the trade tensions with America. In percentage terms, Africa was the biggest loser with a drop of -7.1%.
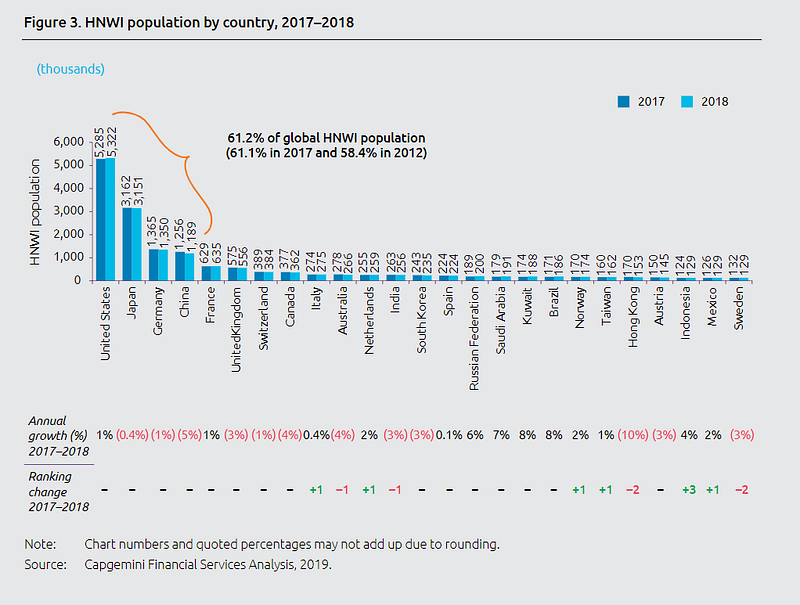
Breaking down the HNWI population by country — the top four markets of the United States, Japan, Germany & China represent 61.2% of the global population in 2018, a small improvement from 61.1% in 2017 (Figure 3). Hong Kong & China were the biggest losers in this segment with a drop of 10% & 5% respectively — Canada & Australia lost 4% each. Brazil & Kuwait were the biggest gainers at 8% each, followed by Saudi Arabia & the Russian Federation with a climb of 7% & 6% respectively. Indonesia gained 3 spots from last year, with Italy overtaking Australia in the ranking despite its economic troubles.
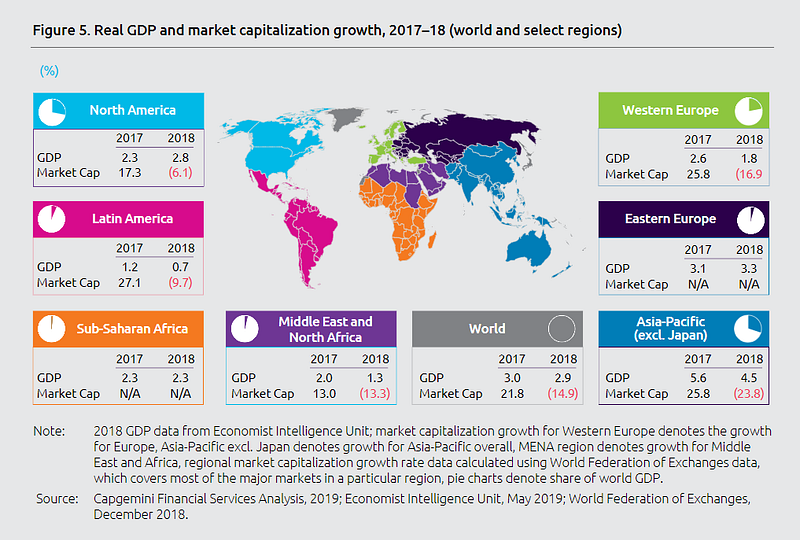
Growth forecasts were trimmed in 2018 as trade wars, economic troubles & geopolitical tensions dragged the global economy lower. With the exception of Eastern Europe which saw a marginal increase in GDP growth from 3.1% to 3.3%, all regions posted sluggish performance in 2018 dropping significantly from 2017 (Figure 5). Market caps dropped across the board, with the biggest decline seen in Asia-Pacific (-23.8%) followed by Western Europe (-16.9%). The near term economic uncertainty is not presenting a rosy picture for 2019 either.
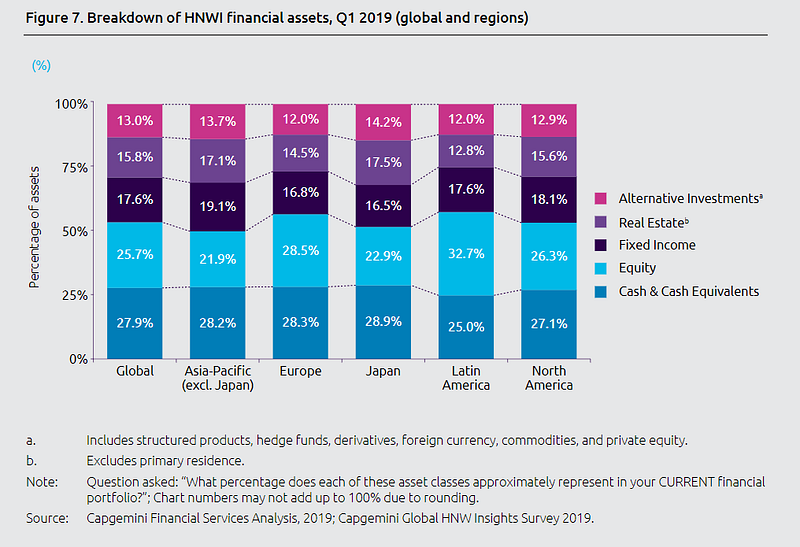
And finally, the chart above shows the breakdown of the asset allocation by investors globally in Q1 2019. As is the case in turbulent economic times, Cash and Cash equivalents replaced Equities as the biggest asset class ~ 28%. Stocks, on the other hand, slipped to second place ~ 26%, down five percentage points from Q1 2018. Again, the biggest drop in was seen in Asia Pacific where Equities represented 21.9% of the HNWI portfolios.
Risk-averse HNWIs in Japan moved their investments to alternative assets offering fixed income — the biggest globally at 14.2%, up nine percentage points from Q1 2018. South America was the exception here with Equities accounting for 32.7% of HNWI investments — a gain of 12 percentage points from a year earlier. This was mostly due to the demographic change as younger investors entered the markets.
Email 📭| Twitter 📜 | LinkedIn 📑| StockTwits 📉 | Telegram 🔗
Originally published at https://www.datadriveninvestor.com on July 11, 2019.