
Easy and Interactive Candlestick Charts in Python
Using Plotly and Streamlit
If you are interested in the financial markets and have some data-science skills (like myself), then you may be attempting to denoise the crazy world of finance through the development of predictive and/or analytical tools. With any data project, a good picture really does speak 1000 words; fortunately, with excellent packages such as Plotly and Streamit, creating beautiful (and interactive) charts has never been easier!
In this post I will focus on using Plotly to create candlestick charts, and eventually move on to showing how these charts can be integrated into a Streamlit dashboard to have an interactive and customisable experience with financial market data. Although Plotly has excellent documentation (see here for the docs on candlestick charts), I personally found myself trawling through stack overflow to answer simple questions such as:
- How to plot over the candlesticks, and also include subplots (for, e.g. other indicators or trading volume).
- How to remove weekend-gaps in trading activity to ensure we have a smooth chart.
- How to label the axes/titles.
And the list goes on! Hopefully this blog post can answer such questions for you, and give a nice-and-simple template for further customisation.
Interested? Let’s dig into some examples with code!
Example 1 — A Simple Candlestick Chart
In this example we will be plotting the data for the ticker TSLA (Telsa). As a side note, you can freely download stock price data using the excellent yfinance package (see here for the docs). Once you pip-install the yfinance package you can download the data using the following code:
import yfinance as yf
df = yf.download('TSLA')
df.to_csv('TSLA.csv')
This will place a csv file in your root directory called TSLA.csv, that contains the daily Open, High, Low, Close and Adjusted Close stock price data, as well as the trading Volume. The candlestick chart can be generated by using the following code snippet (assuming that the TSLA.csv file is in the same directory as this code!)
Nice and simple huh? When run, this code will open up an interactive chart in your browser. I have included a GIF to show the sorts of actions you can do with these candlestick charts:
Pretty neat! We can zoom into portions of interest (both on the chart and using the “rangeslider” at the bottom), and save the chart to a png file (quite useful for building a database of chart patterns!). Note that the weekend gaps have been removed by including into the code
fig.update_xaxes(rangebreaks = [{'bounds': ['sat', 'mon']}])which updates the x-axis to remove the gaps between Saturday and Monday. Although this is pretty cool, I had some issues with this simple chart:
- The chart interface is quite slow to use, this is because you’re plotting the entirety of TSLA’s stock history. This gets even worse if you plot a financial instrument that has been around for longer (like MSFT, for example).
- The scales are not correct once you zoom in because the y-axis does not update, you’re stuck between the min and the max prices.
- The rangeslider is a bit clunky, I’d rather replace it with another chart, like the trading volume. This is of course down to your preference!
- It would be nice to include some technical indicators on the candlestick charts, like simple moving averages of the closing price.
Fortunately we can fix all these things! Let’s consider the next example to see how this is done.
Example 2 — Using Subplots and Adding to the Candlestick Chart
Fortunately, the rather simple solution to points 1 and 2 above is to plot over a fixed range, so that the min-max prices are more closely grouped; for this example I chose the most recent 120 trading days to plot. Likewise, removing the rangeslider (point 3) is also easy, we simply update the fig.update_axes code with the following:
fig.update_xaxes(
    rangebreaks = [{'bounds': ['sat', 'mon']}],
    rangeslider_visible = False,
)
Adding subplots is a little more complicated and requires some changes, but it can be achieved using plotly.subplots.make_subplots. Personally, I think my blabbing on will make the explanation of including subplots more confusing, so perhaps the code is more of a concise explanation:
Just a few notes here:
- I chose to plot the 10 and 20 day simple moving averages. These can be calculated in pandas using
df['ma'] = df['Close'].rolling(n).mean(), wherenis the moving average length. You can also swap out the.rolling(n)for an.ewm(n)for the exponentially weighted moving average. There is also no obligation to use the closing prices, using'Open'is also fine. - The plots are referenced by their row and column numbers. In this case, more can be added to the candlestick by adding the chart to
row = 1, column = 1. - I made no attempt to change the colours of the plots simply because I am a terrible artist and Plotly chooses better colour schemes than I ever could…
Here is how the outcome looks.
Much better in my opinion! Another thing I think is super cool about Plotly is the ability to turn on/off charts by simply clicking them in the legend.
Let’s go one step further… how about a dashboard with interactive controls to change the moving average lengths, or even to select different financial instruments.
Example 3 — Placing the Plotly Chart on a Streamlit Dashboard
Streamlit really is a fantastic Python package. I find it incredibly intuitive, the documentation is excellent, and you can create fully customisable dashboards in short amounts of code. Sure, you may have more customisability with Plotly Dash, but I prefer using Streamlit purely because you can get great dashboards with less development time.
There are already plenty of amazing blog posts on Medium from other skilled data-scientists, such as this one by Sharone Li, or this one by Maarten Grootendorst; therefore I won’t go in-depth of how to use Streamlit, but rather how we can use it for this candlestick charting example.
I have introduced four controls onto the dashboard:
- The ticker selection (dropdown list).
- The number of trading days to plot (as a slider).
- The length of the first moving average in days (a number input box).
- The length of the second moving average in days (a number input box).
After installing streamlit using pip install streamlit, you can run the 42 lines of code below by typing streamlit run dash.py in your terminal (I run Streamlit through the anaconda prompt, that’s also where I pip installed it). Note, I saved this code under the file name dash.py.
Please note that I imported the candlestick chart creator on line 3 (the code from example 2). For this dash to work, the example 2 code needs to be saved in a py file called draw_candlestick_complex.py. Also make sure to download the AAPL and MSFT stock market data as per the instructions on example 1.
Here is how the dash looks:
As you can imagine, with a bit of ingenuity you can make your very own interactive stock-market dashboard with custom indicators (or even fancy AI helpers!). For example, this is one I have been playing around with in my spare time:
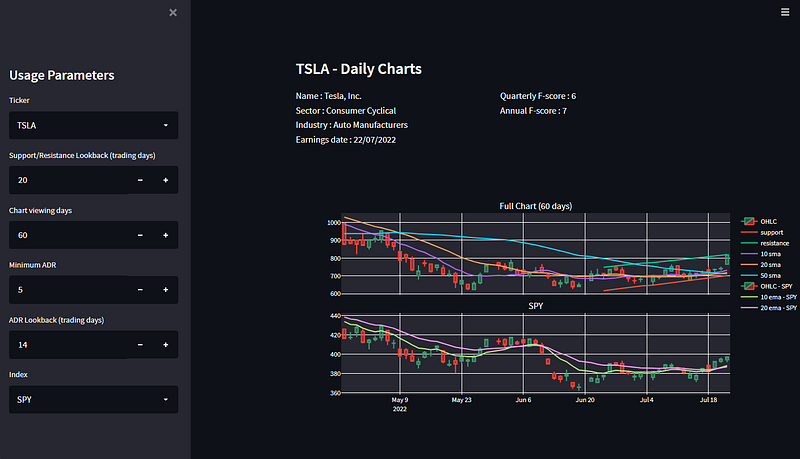
The trend lines can be easily drawn algorithmically, which you can read about in another one of my articles:
Wrapping Up
Through this article we have looked at how we can leverage both the Plotly and Streamlit packages to produce some interactive candlestick charts. The code supplied here should hopefully give a good starting point for further modifications, so that you can tailor things to the way you like!
By the way, this article has been moved to my personal website, where it’ll be maintained and added on in the future:
Thank you for reading, I hope you enjoyed the article! Please feel free to connect with me on LinkedIn — I’d love to hear from you! Also feel free to follow/DM me on twitter.
If you are thinking getting a medium account, then please consider supporting me and thousands of other writers by singing up for a membership. For full disclosure, singing up through this link grants me a portion of your membership fee, at no additional cost to you (a win-win for sure!).
Or if you’d like another way to support my content creation, then you could

Because I work a full-time job, go to the gym, trade, and write on Medium, I use a lot of coffee!


