
streamlit
Quickly Build and Deploy a Dashboard with Streamlit
Deploying your Streamlit application to Heroku to showcase your Data Solution
With the launch of Streamlit, developing a dashboard for your machine learning solution has been made incredibly easy.
Streamlit is an open source app framework specifically designed for ML engineers working with Python. It allows you to create a stunning looking application with only a few lines of code.
I want to take this opportunity to demonstrate the apps you can build using Streamlit. But mostly, to show you the steps necessary to bring your application into production using Heroku.
1. Streamlit
A few of the advantages of using Streamlit tools like Dash and Flask:
- It embraces Python scripting; No HTML knowledge is needed!
- Less code is needed to create a beautiful application
- No callbacks are needed since widgets are treated as variables
- Data caching simplifies and speeds up computation pipelines.
Have a look at this post which might help you understand the architecture of Streamlit. Moreover, this post
Installation
Streamlit can easily be installed with the following command:
pip install streamlit
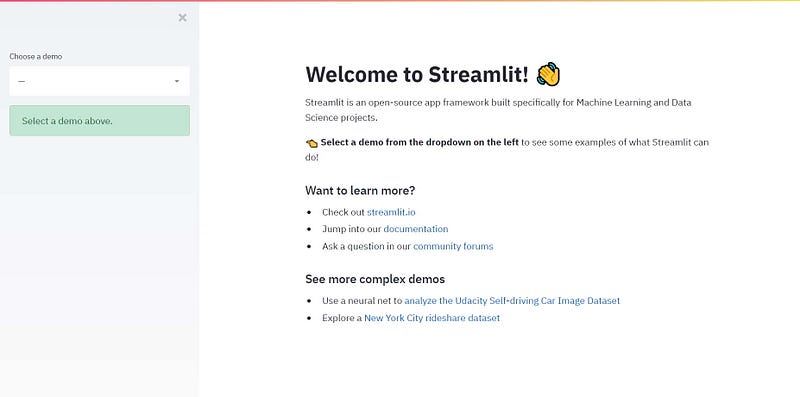
Use the following command to see a demonstration of an application with example code:
streamlit hello
Doing this will result in the following page to be opened:
2. Demos
Above from the streamlit hello demo above there are a few more complex demos available online for you to try out. I will list a few (including mine) below such that you will have an idea of the possibilities:
The Udacity Self-driving Car Image Browser
This demo shows how the Udacity car dataset can be combined with object detection in less than 300 lines of code to create a complete Streamlit Demo app.
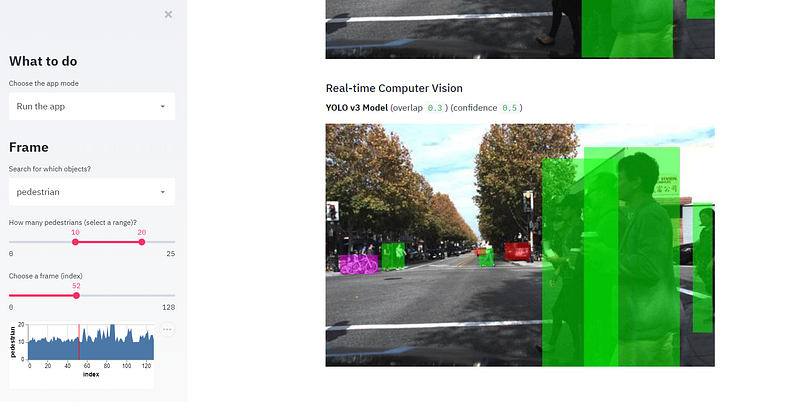
First, install OpenCV so that the images can be analyzed:
pip install --upgrade streamlit opencv-pythonNext, simply run the app:
streamlit run https://raw.githubusercontent.com/streamlit/demo-self-driving/master/app.pyUber Pickups in New York City
This is a Streamlit demo to show how you can interactively visualize Uber pickups in New York City.
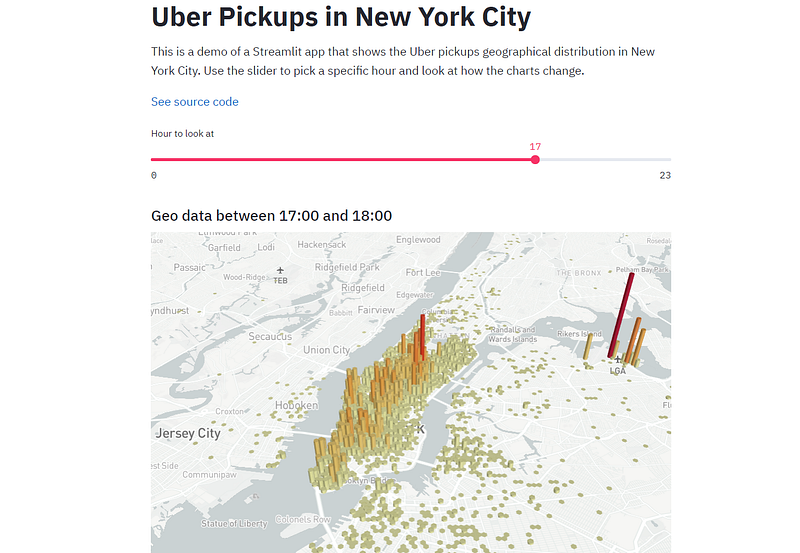
Simply run the code below after installing Streamlit:
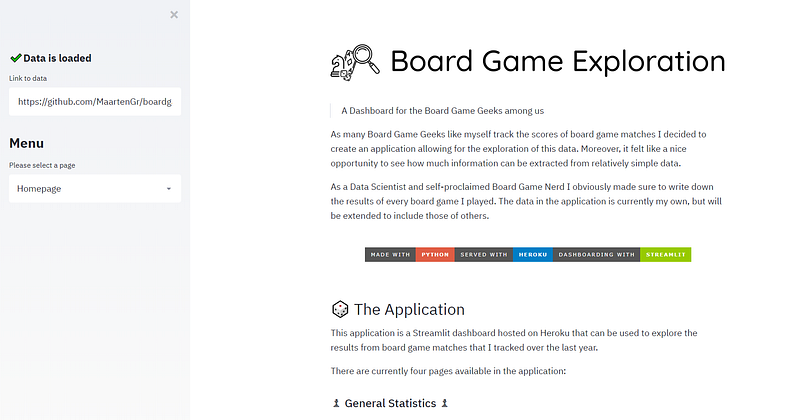
streamlit run https://raw.githubusercontent.com/streamlit/demo-uber-nyc-pickups/master/app.pyBoard Game Exploration
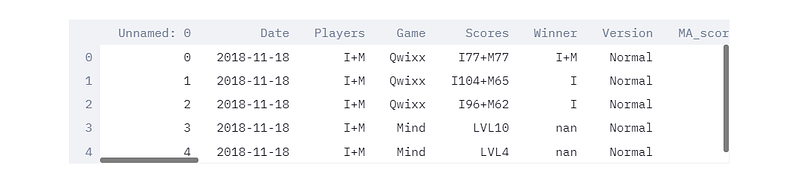
As many Board Game Geeks like myself track the scores of board game matches I decided to create an application allowing for the exploration of this data. You can view this application live here, or you can run it locally by following the steps below.
Since I make use of several.py files, you first need to clone the repository:
git clone https://github.com/MaartenGr/boardgame.git BoardGameThen, simply go to the folder and run Streamlit:
cd BoardGame
streamlit run app.pyNOTE: You can use your own data if you like by simply providing the URL to your data.
3. Creating an Application
In this section, I will demonstrate how to create a simple application seeing as the main purpose of this post is to prepare your project for deployment.
If you want more in-depth examples check out Streamlits API or check this or this post which nicely describes many of its features.
But first, let me introduce some basic features that you are likely to be using in your own apps.
Selection Widgets
One of the main features of Streamlit is the usage of widgets. There are many widgets available including the following:
- SelectBox
age = streamlit.selectbox("Choose your age: ", np.arange(18, 66, 1))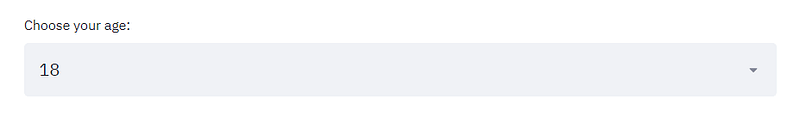
- Slider
age = streamlit.slider("Choose your age: ", min_value=16,
                       max_value=66, value=35, step=1)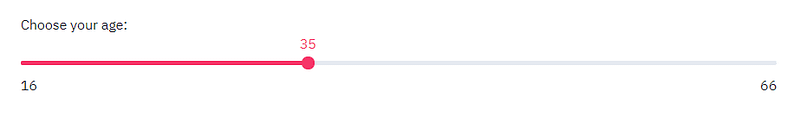
- MultiSelect
artists = st.multiselect("Who are your favorite artists?",
                         ["Michael Jackson", "Elvis Presley",
                         "Eminem", "Billy Joel", "Madonna"])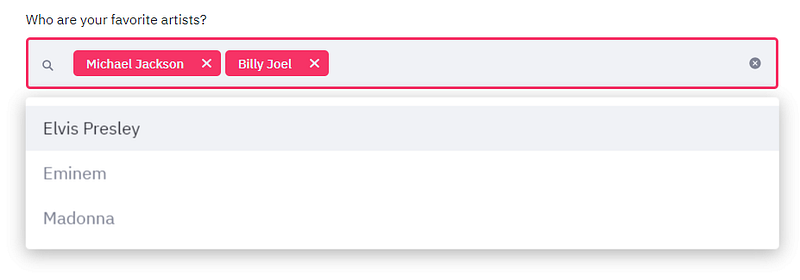
Caching
The problem with many dashboarding tools is that data is reloaded every time you select an option or switch between pages. Fortunately, Streamlit has an amazing option allowing you to cache the data and only run it if it has not been run before.
The code above shows that you can cache any function that you create. This may include loading data, but also preprocessing data or training a complex model once.
Visualization
Streamlit supports many visualization libraries including: Matplotlib, Altair, Vega-Lite, Plotly, Bokeh, Deck.GL, and Graphviz. It even can load audio and video!
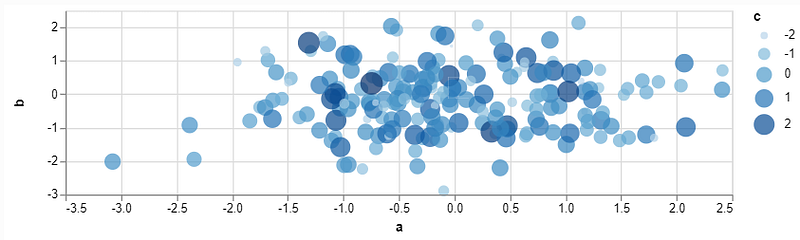
Below is a quick example of showing an Altair plot:
Markdown
Personally, I am a big fan of markdown and its possibilities of creating nicely looking and REAMDEs. Luckily, we can generate markdown with only a single function:
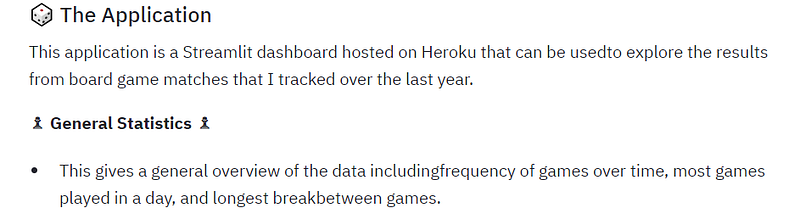
NOTE: Based on the commits in the dev branch st.latex seems to be coming shortly!
Write
The Write function is the swiss-army knife of the Streamlit commands. It behaves differently based on its input. For example, if you throw in a Matplotlib figure it will automatically show you that visualization.
A few examples:
- write(string) : Prints the formatted Markdown string.
- write(data_frame) : Displays the DataFrame as a table.
- write(dict) : Displays dictionary in an interactive widget.
- write(keras) : Displays a Keras model.
- write(plotly_fig) : Displays a Plotly figure.
You can find a full overview of its possibilities here.
4. The Application
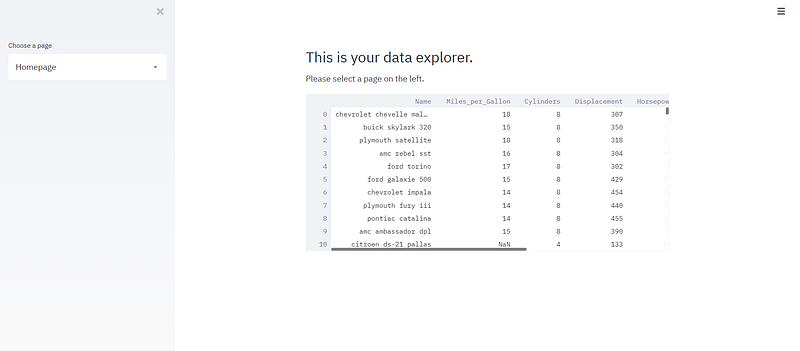
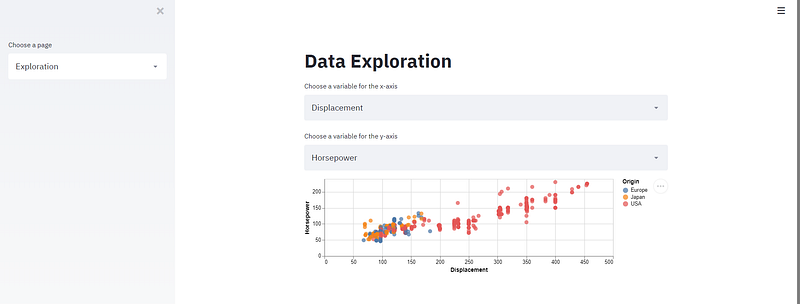
To show how to deploy your application we first need to create a basic application. The example will be a simple demo that has two pages. On the homepage, it shows the data that we selected whereas the Exploration page allows you to visualize variables in an Altair plot.
The code below gives you a Selectbox on the sidebar which allows you to select a page. The data is cached so that it does not need to reload constantly.
Running the code streamlit run app.pywill show you the following page:
Selecting the page Exploration will show you the following visualization:
5. Heroku deployment
Now that we have our application it would be nice if we could host it online somewhere. That way, you can demonstrate the application that you made to others. We are going to do this by deploying it to Heroku, which is a platform as a service (PaaS) which can be used to run applications fully in the cloud.
First, make sure you have the following files in your application folder:
.
├── app.py
├── requirements.txt
├── setup.sh
└── Procfile
You can find all these files in the repository here.
Create Account
To deploy the app you will first need to create an account on Heroku here. Do not worry, hosting your application is entirely Free!
The main disadvantage of using a free account is that the website will go down if it has not been visited for more than half an hour. However, it will restart the moment you open the site.
Install Heroku Command Line Interface
Next, you will need to install the Heroku Command Line Interface (CLI) here. You will use this to manage your application, run it locally, view its logs, and much more.
Login to Heroku
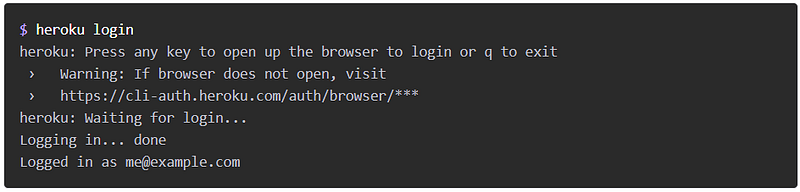
After doing this, open your cmd.exe and cd to the application folder. Then, log in to Heroku with heroku login. You will be redirected to a login screen on your preferred browser.
Deploy the App
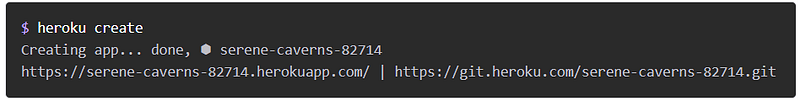
Finally, while having your cmd open in your application folder, first run heroku create to create a Heroku instance:
Then, push all your code to that instance with git push heroku master:
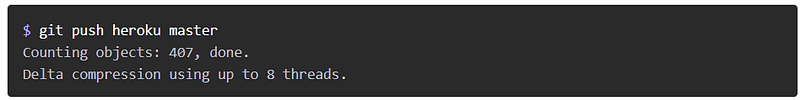
This will create a Heroku instance and push all code in your application folder to that instance. Now, the app should be deployed.
Runheroku ps:scale web=1 to ensure that at least one instance of the app is running:

Finally, open your application with heroku open: which will visit the app using your preferred browser at the URL generated by its app name:

All code can be found here:
If you run into any problems when deploying to Heroku, please follow this page for an extensive overview of the procedure.
If you are, like me, passionate about AI, Data Science or Psychology, please feel free to add me on LinkedIn.


