
Using Obsidian’s Graph View for real
I’ll bet anyone using Obsidian will soon show you a graph view — that impressive looking web of nodes and links. There’s even a whole channel on the Obsidian Discord for people to show off their graphs. But most guides tell you what the graph can do, not what you should do with it. Most times, you are shown a few features and then told “just play around”.
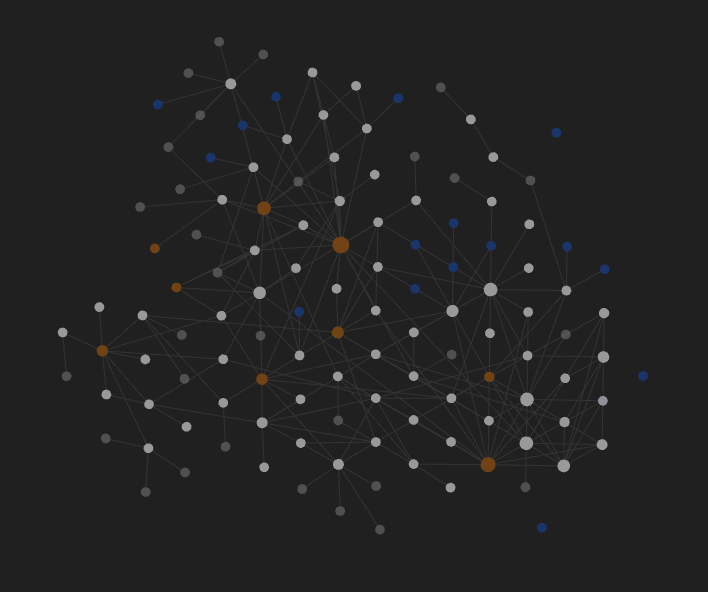
I’ve used network charts at work quite a bit. In corporate investigations, I used it to detect connections between companies using their registration information. I later used network charts to link interesting people and events. So in an effort to see what we can really do with one of Obsidian’s key draws, I summarized the main ways you should use Obsidian’s graph view.
Use it like…a second brain!
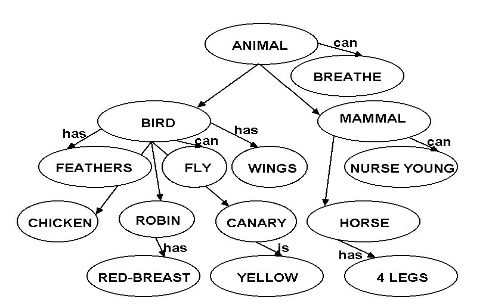
Your long-term memory works by associating similar words or ideas together. That’s why you might associate “Bird” with multiple concepts and words.
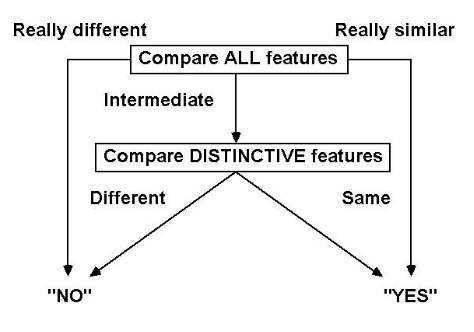
When trying to find the right word, your brain tries to compare each word in this cloud with the one you are seeking. Comparison involves two steps. First, do a quick match on all features. If they’re really similar or really different, respond “yes” or “no.” Then look at distinctive features and compare again to reach a final “yes” or “no”.
When looking for a note you know exists but can’t seem to recall the title, it’s far better to open up your whole graph and explore it from a note that is close to what you’re looking for. That way you not only see note titles (which you’d see in a search) but also what tags or other notes they are linked to, giving you more information to compare again what you’re looking for.
Explore adjacent notes more deliberately
This is perhaps the simplest use case. When you’re exploring your vault and trying to get inspired, you could decide on which note to read next based only on its title, or decide whether you want to explore the boundaries of your thoughts (go to notes with fewer links) or see how your thoughts have been aggregating (go to notes with more links).
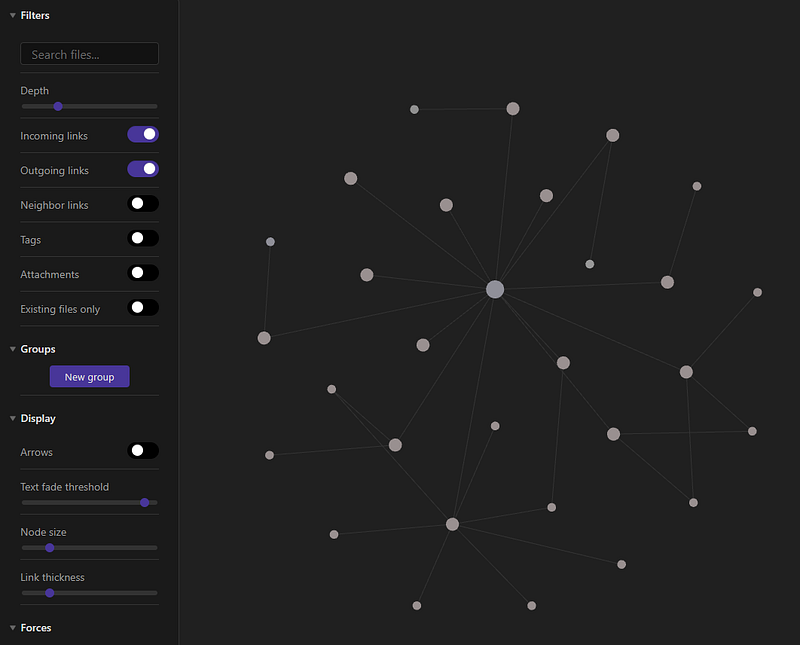
To do so, use the local graph view and set the depth to 2. Turn off neighbor links, use filters and group notes based on colour. Generally you’re trying to keep the settings biased towards fewer notes. That will let you focus on a smaller set of notes, rather than flooding you with possible notes to read. Check out https://thesweetsetup.com/the-power-of-obsidians-local-graph/ for more on this.
Tip: The filter uses an AND function, so if you want to filter for note that contain either of two specific tags use: (tag:#A -tag:#B) OR (-tag:#A tag:#B)
Identify potential clusters
I was asked once about how to create MOCs in Obsidian and my stance is that if you’re trying to make sense of an unfamiliar space, MOCs are best created as emergent classes depending on what you include in your notes.
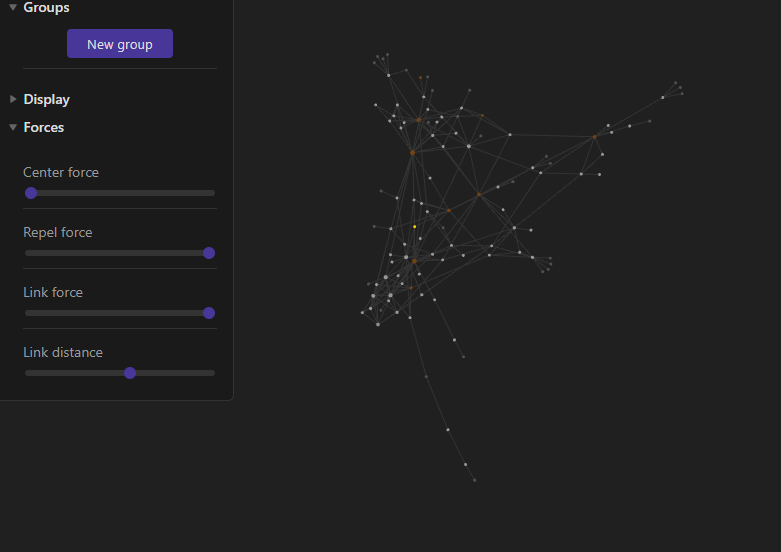
Once you have a sizeable cloud of raw notes, that when you can use the Forces and Groups settings to identify potential clusters of notes:
- Forces. So many people in the Obsidian community tell you to “play” with the forces! That’s because depending on your starting point, your graph will turn out differently when you move the force sliders. Use the Link Force and Link Distance to exaggerate the clusters. Use Centre Force and Repel force to make the entire graph bigger.
- Groups. Clusters can also be identified when more of a certain file type tends to be linked to each other. Use the Groups feature to make specific notes or tags different colours.
Track the development of a concept
Lastly, you can use the animation function and the filter function together to help you see how a specific area of your vault developed. But be warned as it’s based on note creation and not event date or last modified date.
Next time, I’ll explore a favourite community plug-in of mine — Graph Analysis. In the meantime, check out Obsidian for group KM, Obsidian for sense-making and Eleanor Konik’s article on the graph view too
Take a look at the rest of my articles on Obsidian:
- When you should consider switching to Obsidian
- Obsidian’s Graph Analysis plugin
- Using Obsidian for group KM
- Obsidian for making sense of things
What other ways have you found the graph view to be useful? Let me know in the comments or just leave a clap for me.


