
How to Create Variables in DAX — DAX in Power BI — Chapter 2
Learn how to use DAX variables in Power BI to make calculations easier to understand and for improved readability, consistency and performance.

When I was studying DAX, I realized how variables are helping to improve performance, readability and reduce the complexity of any DAX calculations.
During this learning process, I put my understandings in this blog. Let’s start our journey to DAX variables.
If you have missed my previous blog about Introduction to DAX, then please have a look to refresh your idea about DAX.
What is the DAX Variable
In DAX calculation, we can use variables to make the calculations easier to understand.
When you are writing any complex or nested expression using DAX functions, variables can help to break these complex calculations into smaller, more useful sections.
Why we need DAX variable
You can use variables in any form of DAX calculations and it includes calculated measures, columns and tables.
A type of variable is nothing but the calculated object type in DAX
Structure of Variable
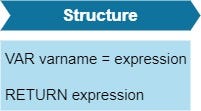
- To close a declared variable scope, there must be a RETURN statement.
VAR varA=2
RETURN varA * 2
2. You can declare multiple variables with the same layer of scope and a single RETURN statement
VAR varA=2
VAR varB=varA+2
RETURN varB*3
3. Variables can be assigned once and cannot be reassigned.
Give an error if you like below
VAR varA=2
varA=varA+2
“The RETURN keyword is used to return the value of any variable in the current scope. This can be useful when you’re debugging calculations with multiple variables. It does not have to return the last variable in the series.” — by Philip Seamark
It’s time to do some hands-on in Power BI Desktop.
Get Data
For this case study, I consider the US Superstore dataset from Kaggle.
- Let’s start with the Get Data option under the Home tab. As this is a CSV file, select the Text/CSV option from the drop-down list
- Select the file named US Superstore data.csv
- After selecting the file, data will be displayed in the below format
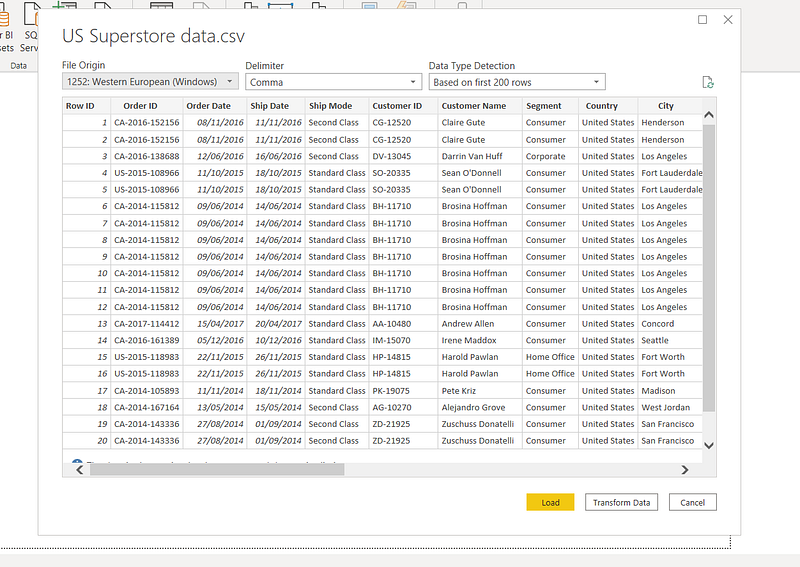
- Click on Load and save data.
VARIABLES WITH TEXT
Variables can store numeric data as well as text. Using this feature, you can create a dynamic text-based measure that can be varied depending on filter selection. Let’s see one example.
- Create one text-based calculated measure (Sales Quantity) using variable
- There are 4 variables. one for the direct measure, two for hard-coded messages and the final result variable where you are using IF clause condition and concatenate operator. Here you are using the result as a return statement.
- To make the next line or new line, press Shift + Enter.
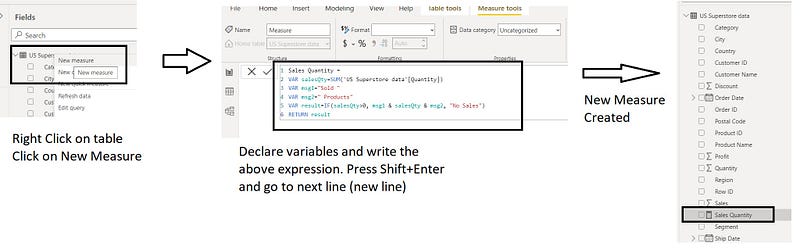
4 . Your first measure using variables has been ready for presentation.
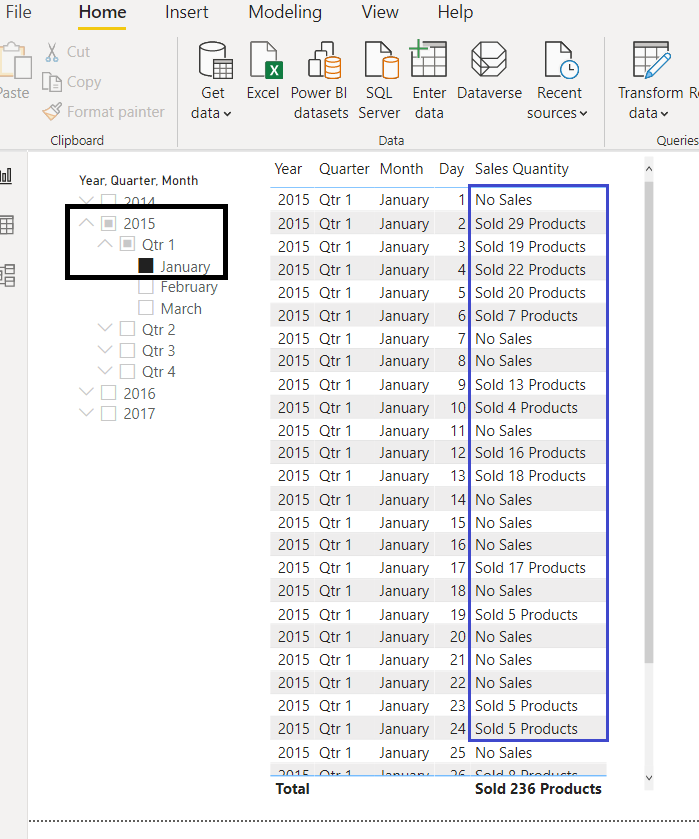
5. Create one Slicer and one table to test your newly created measure.
6. For Slicer, add Order Date Hierarchy in the Field section.
7. For Table visual, add Order Date Hierarchy and Sales Quantity in the Values section.
8. Display report with some filter condition like 2015 as Year, Quarter as Qtr1, Month as January and observe the report result.
VARIABLES IN CALCULATED COLUMNS
When you are creating variables inside calculated columns, variables automatically get access to values in other columns from the same row.
It can be useful to display text-based data in some visuals.
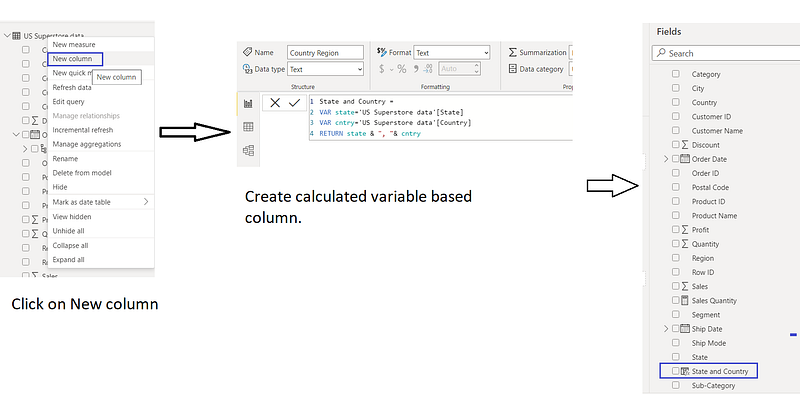
- Create your first calculated variable based column.
- Please follow the below steps to create that.
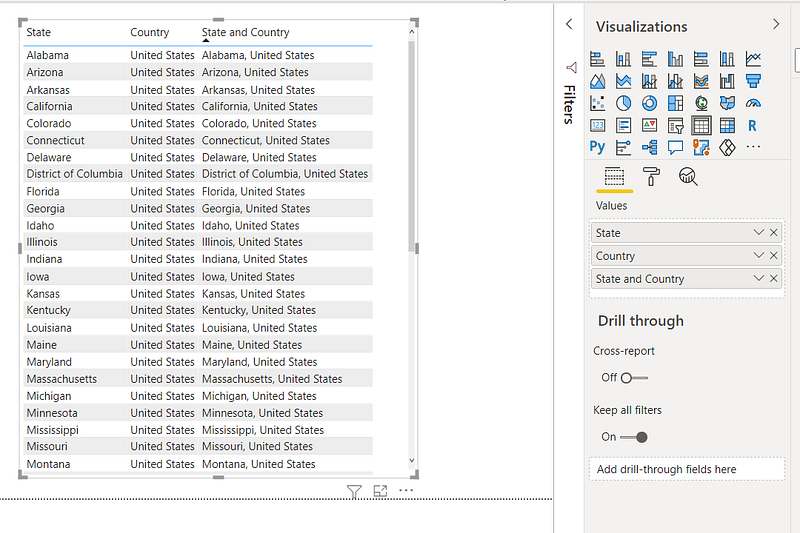
3. Create a Table visual to see the output.
VARIABLES IN CALCULATED MEASURES
To make a calculated measure faster, you can use variables.
However, variables in calculated measures do not relate with individual rows that mean it cannot be assigned as a column-based value. This is the key difference with variables in calculated columns.
Let us see some example.
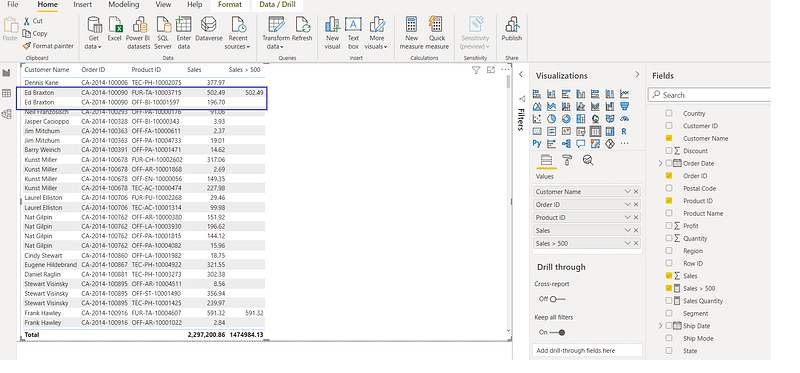
- Create one calculated measure Sales > 500 with variable.
- Change the number Formatting from the Whole Number to a Decimal Number with 2 decimal places.
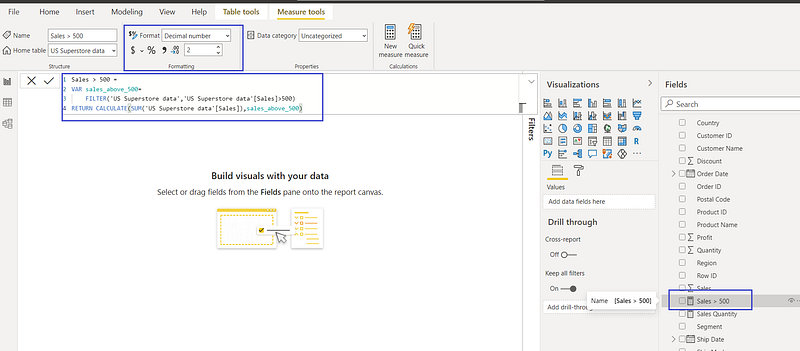
3. Create your report with Customer Name, Order ID, Product ID, Sales and Sales > 500.
4. Now analyse the report. For example, Ed Braxton placed one order for two products. For one product sales value is above 500 and another one is below 500.
VARIABLES IN CALCULATED TABLES
Variables in the calculated table are useful when you are creating any summary or aggregated table from the existing table. It helps to improve the performance of the report page.
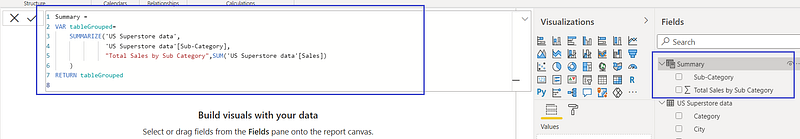
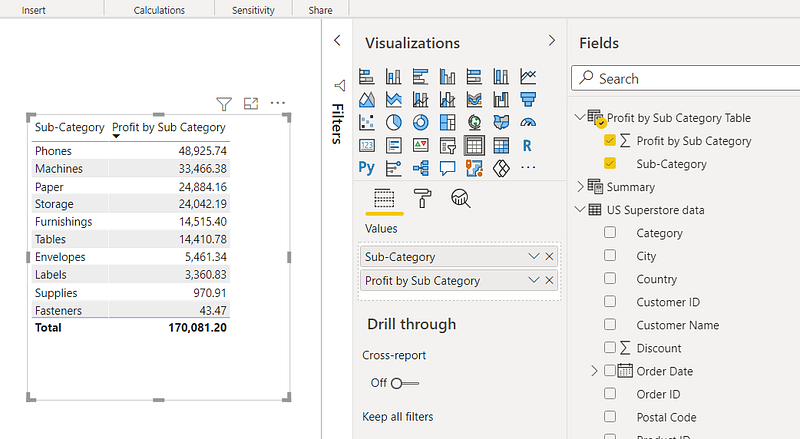
- Create one calculated table “Summary” using a variable.
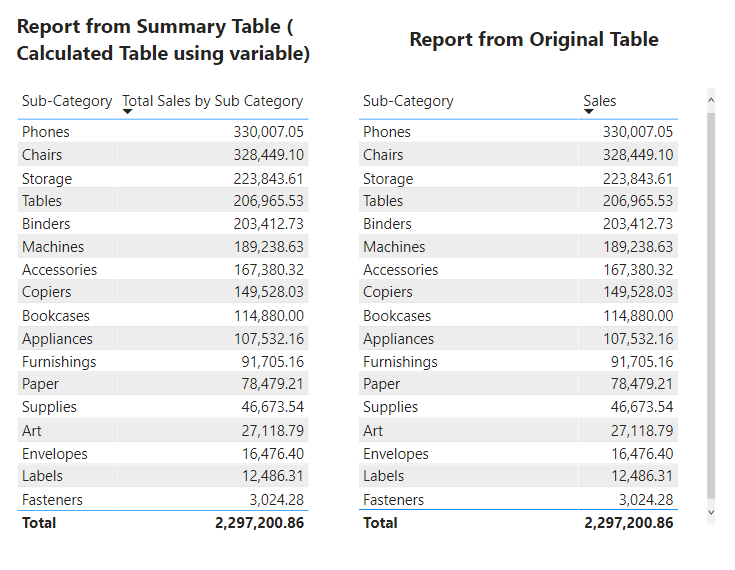
2. Now create two reports and compare the results whether your calculated table is working as expected or not.
NESTED VARIABLES
Variables can be nested and can exist within the same calculation.
The scope of each variable starts with a VAR statement and ends with a RETURN statement and can only be referred to by other variables which are declared at the same level or higher.
- Now you are going to create one calculated table using a nested variable. See the below example.
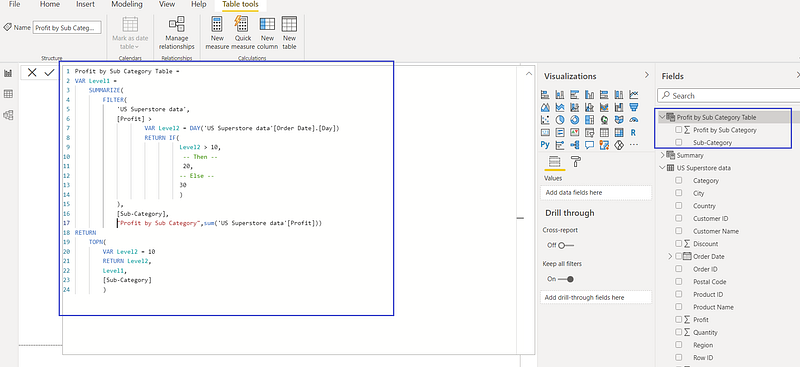
2. It’s time to create one report using this table. You can create more detailed reports to validate your result. As well as change the value for the Level2 variable and see the difference.
Download
Please find the code in the below location
DAX — Chapter 2 https://github.com/arpitag1/Power-BI
Video
Conclusion
In this blog, the following things have been identified
- What is DAX Variable
- Why we need DAX Variable
- Structure of Variables
- Variables in Text
- Variables in Calculated Column
- Variables in Calculated Measure
- Variables in Calculated Table
- Nested Variables
In my next blog, we will learn more about DAX.
If you have any questions related to this project, please feel free to post your comments.
Please visit my website for other technical resources.
Please like, comment and subscribe to my YouTube channel which you have already seen. :-) Keep Learning.


