
Introduction to DAX in Power BI — DAX in Power BI — Chapter 1
This is a step by step tutorial starting with an introduction to DAX operators, DAX function categories, DAX data model components and first hands-on experience with DAX

For any POWER BI job description, you will find one competency is mandatory. Any idea what is that? Yes, you are right. It is DAX.
DAX is playing an important key role in any Power BI project. In this blog series, I will capture my understanding of DAX with some practical code.
What is DAX?
DAX (Data Analysis Expressions) is known as a functional language. It means, calculations mostly use functions to generate the results.
DAX is designed for enhancing data modelling, reporting and analytics capability.
DAX Data Type
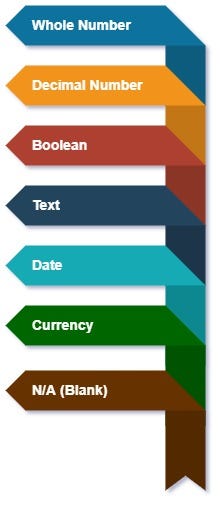
In DAX, it is possible to define the data type for each column based on your requirement.
The selection of the best data type helps to reduce the size of a data model and improve the performance when to refresh data and use of any report.
DAX Operator
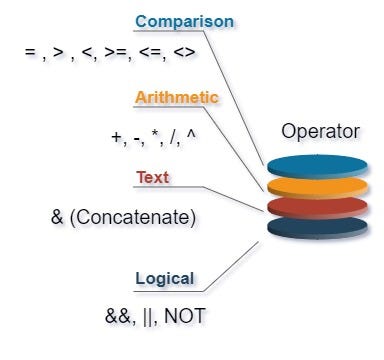
DAX operators are divided into four categories: comparison operators, arithmetic operators, text operator, and logic operators.
DAX Function Category
You can write a nested function using DAX but you cannot create your own.
There are more than 200 DAX functions. There are 9 categories in the DAX function.
- Date and Time
- Time Intelligence
- Information
- Logical
- Mathematical
- Statistical
- Text
- Parent/Child
- Other
Components of DAX Data Model
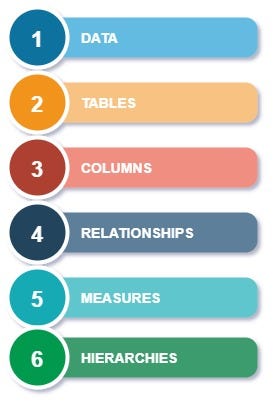
A data model consists of data, calculations and formatting rules and it combines to create an object. This object helps to explore and understand the dataset.
Your First Practical Experience with DAX
Till now you have some idea about DAX and its importance. Before moving to discuss each DAX function category, let us get some hands-on experience with DAX.
Get Data
For this case study, I consider the US Superstore dataset from Kaggle ( https://www.kaggle.com/juhi1994/superstore)
- Let’s start with the Get Data option under the Home tab. As this is a CSV file, select the Text/CSV option from the drop-down list
- Select the file named US Superstore data.csv
- After selecting the file, data will be displayed in the below format
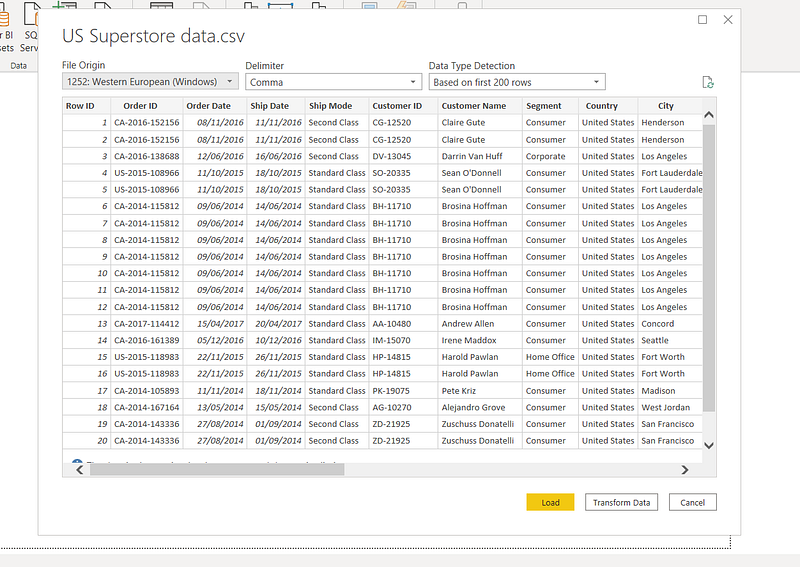
- Click on Load and save data.
There are 3 types of calculations in DAX.
- Calculated Columns
- Calculated Measures
- Calculated Tables
Example 1 (Calculated Measure)
- Create calculated measure Total Sales
Total Sales = SUM(‘US Superstore data’[Sales])
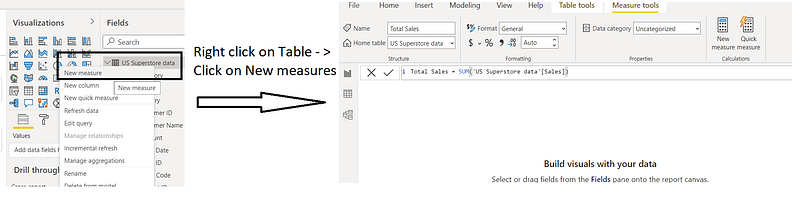
2. Similarly, create a calculated measure of Total Profit.
Total Profit = SUM(‘US Superstore data’[Profit])
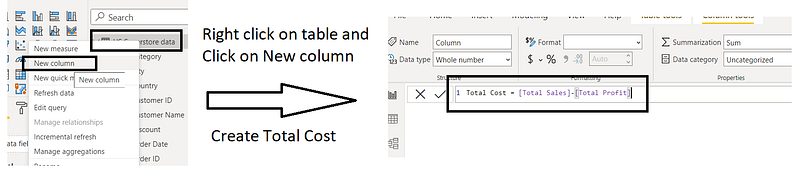
Example 2 (Calculated Column)
- Create calculated column Total Cost.
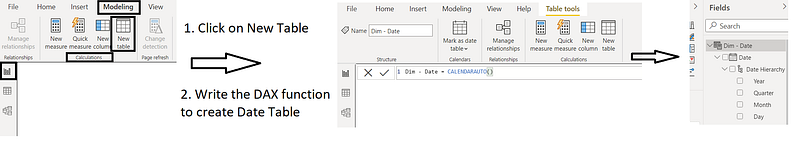
Example 3 (Calculated Table)
- In Report View, go to Modeling Tab and click on New Table under Calculations group.
- Create a calculated table (e.g. Date Table).
Download
Please find the code in the below location
DAX — Chapter 1 (https://github.com/arpitag1/Power-BI)
Video
Conclusion
In this blog, the following things have been identified
- What is DAX
- What are all DAX Operators
- How many types of DAX categories
- How many components are there in DAX Data Model
- First Hands-on Experience with DAX.
In my next blog, we will learn in detail about DAX.
If you have any questions related to this project, please feel free to post your comments.
You can check my Medium Profile for other related blogs and please like, and share comments if you feel it will help others to learn.
Please like, comment and subscribe to my YouTube channel which you have already seen. :-) Keep Learning.