
Understanding the Effectiveness of Pressing in Different Game Scenarios
Quantifying Pressing Effectiveness in Football with A Novel Metric Revealing the Trade-off Between Ball Recovery and Defensive Structure
Introduction
The introduction of the research paper highlights the importance of pressing in football defense and its impact on a team’s success. Effective pressing can disrupt opponents’ play, but it also poses risks. The paper introduces the VPEP metric, inspired by the VAEP metric, as a novel approach to quantify the effectiveness of pressing actions. Using event data from StatsBomb, the authors analyze matches from the 2018/19 seasons of the top European leagues. They discuss the objective rating of pressing decisions as a risk-reward trade-off and propose using machine learning to express the risk and reward as probabilities. The paper concludes by highlighting the potential of the VPEP metric in identifying weaknesses in team and opponent pressing strategies.
The VPEP metric is heavily inspired by VAEP metric according to the authors. If you want to explore this metric you can read any of the articles I posted about it.
VPEP: A framework to assess the risk-reward trade-off of pressing
The section discusses the risk-reward trade-off involved in pressing and introduces the VPEP framework as a method to assess this trade-off. Pressing aims to quickly win the ball back and prevent the opposition from developing an attack. However, an aggressive high press can also leave defensive vulnerabilities and lead to conceding goal-scoring opportunities. The decision to press requires players to evaluate the rewards of regaining possession versus the risks of conceding a goal-scoring opportunity. The framework calculates the probabilities of ball recovery (P_recovery) and conceding a goal-scoring opportunity (P_attack) based on game states (S_i=[a_1,…a_i]) and pressure events (p_i).
They use the SPADL language (also explained in the first article linked above) to describe these actions. SPADL describes each action in terms of nine attributes.
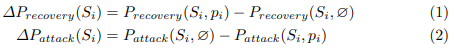
The metrics ∆P_recovery and ∆P_attack represent the changes in these probabilities with and without pressing. The total value of a pressure event (V(Si)) is then calculated by combining these changes, with a factor C (in their case C=5) to account for the higher cost of failure compared to the reward of success.

Estimating the success and failure probabilities of pressing
Next, the authors talk about the process of estimating the success and failure probabilities of pressing. To achieve this, the authors employ binary probabilistic classifiers trained on historical match data. The goal is to estimate the probabilities P_recovery(Si, pi) and P_attack(Si, pi) for a given game state Si and set of pressure events pi by the defending team during that game state. The authors choose XGBoost stacked with a logistic regression model as their classifier, ensuring well-calibrated probability estimates. To train the classifier, each game state is converted into a feature-vector format. The paper then proceeds to explain the computation of labels and features for each game state.
Labels
Here the paper focuses on the assignment of labels for the classification problems related to estimating the probabilities of ball recovery (Precovery) and conceding a shot (Pattack) for a given game state Si and set of pressure events pi. For Precovery the authors assign a positive label (1) to a game state Si if the defending team concedes a shot within the subsequent k actions, and a negative label (0) in all other cases. On the other hand, for Pattack the authors assign a positive label (1) to a game state Si if the defending team recovers the ball within the subsequent k actions, and a negative label (0) in all other cases.
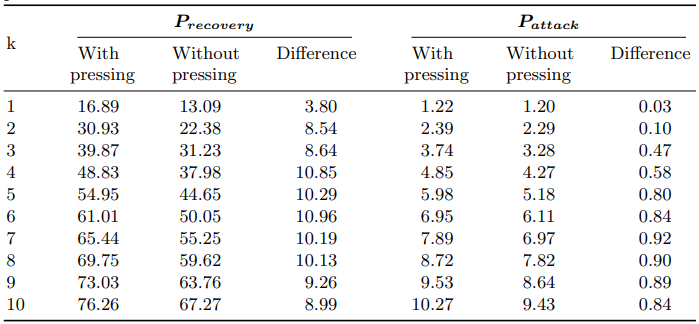
The parameter k represents the lookahead distance in actions, determining how far ahead in the future the effects of an action are considered. For Precovery, the authors choose k = 4 to capture the short-term objective of regaining possession quickly, while for Pattack, k = 7 is chosen. The selection of these values is based on the observed significant impact of pressing on Precovery and Pattack. Additionally, the authors highlight the preference for k = 4 for Precovery to better align with the goal of regaining possession within a short time frame of approximately five seconds.
Features
In this section, the paper discusses the features used to describe a game state Si and their impact on the probabilities of ball recovery and conceding a goal-scoring opportunity. Instead of considering the entire game state, the authors focus on the previous three actions [ai-2, ai-1, ai] as they contain the most relevant information in the current context. Based on the SPADL representation, three categories of features are defined:
- SPADL features: Categorical and real-valued features are derived from the explicit information provided in the SPADL representation. This includes features such as the action type, result, body part used, (x, y)-coordinates of the action’s start and end locations, and time elapsed since the start of the game.
- Complex features: These features combine information within an action and across consecutive actions. They include the distance and angle to the goal for both the action’s start and end locations, the distance covered during the action in the x and y directions, the distance and elapsed time between consecutive actions, and whether the ball changed possession. These features provide insights into the current speed of play.
- Game context features: These features capture the game’s overall context, including the number of goals scored by the team possessing the ball and the defending team after action ai, as well as the goal difference. These features account for the fact that teams often adapt their playing style based on the current scoreline.
- Pressure features: These features are associated with each pressure event and include the distance between the defender and the ball, the angle between the defender’s goal, the ball, and the defender, and the time delay between the start of the action and the start of the pressure. These features provide information about the proximity and timing of defensive pressure.
By incorporating these features, the model captures important aspects of the game state that influence the probabilities of ball recovery and conceding a goal-scoring opportunity, enabling a more comprehensive analysis of pressing effectiveness.
Experiments
The experiments conducted to evaluate the proposed metric are explained together with its underlying machine learning models. Since there are no ground truth ratings available for pressing, the evaluation focuses on the performance of the binary probabilistic classifiers that estimate Precovery and Pattack.
The experiments are conducted using StatsBomb event data from the 2018/19 season of the top divisions in English, Spanish, German, Italian, and French leagues. Due to the limited dataset, a separate training set is not used. Instead, the first 80% of the games in each league are used to train the classification models using the XGBoost algorithm and the previously described feature set. The remaining 20% of the games are used as a validation set to prevent overfitting.
The learned models are then applied to all 1826 games in the dataset to generate VPEP ratings for the entire 2018/19 season. The experiments aim to assess the performance of the models and provide insights into how the proposed framework behaves and compares to other metrics. Additionally, the paper presents use cases demonstrating how teams can leverage the VPEP metric to identify weaknesses in their pressing strategies.
By conducting these experiments on real-world match data, the paper validates the effectiveness and applicability of the proposed framework in evaluating pressing strategies and providing valuable insights to teams.
Evaluation of the probabilistic classifiers
The next step is to evaluate the probabilistic classifiers used in the VPEP framework. Again, since there are no objective guidelines for determining the effectiveness of pressing in different game contexts, the evaluation is based on the components of the metric itself. The evaluation considers two aspects: accuracy and calibration.
The accuracy of the classifiers is assessed by measuring their ability to accurately predict whether the defending team will recover the ball or concede a goal-scoring opportunity in the near future. The area under the receiver operating characteristic curve (ROC AUC) is used as the evaluation metric. With a ROC AUC of 0.902 for Precovery and 0.806 for Pattack, the classifiers demonstrate a reasonably high accuracy in distinguishing between positive and negative examples.
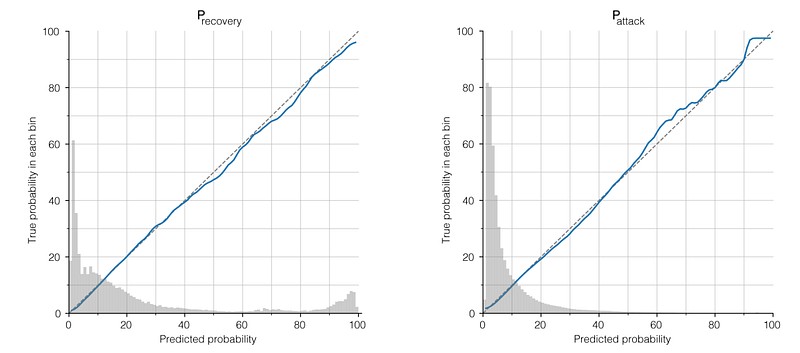
The calibration of the predicted probabilities is another important aspect of the evaluation. The paper emphasizes the importance of the predicted probabilities aligning with the true underlying probability distribution of the data. To evaluate this, the authors examine whether the predicted probabilities correspond to the actual occurrence of events in the data. They collect game states for which the model predicts a specific recovery probability and assess whether the observed recovery rate matches the predicted probability. The probability calibration curves shown in Figure 1 demonstrate that the classifiers achieve good calibration.
Overall, the evaluation of the probabilistic classifiers shows that they are capable of accurately predicting recovery and conceding probabilities and exhibit good calibration. These findings validate the reliability and effectiveness of the classifiers within the VPEP framework.
Intuition behind the values
The intuition behind the values calculated by the VPEP framework is described using a specific example of a pressing sequence by Barcelona against Huesca. The sequence involves three pressure events and highlights the varying ratings assigned to each event based on their effectiveness and impact on the opponent’s decision-making.
The example starts with Barcelona’s midfielder Rakitić putting pressure on Huesca’s left-back Luisinho, who is forced to pass the ball backwards to his teammate Etxeita due to the pressure. At this point, Rakitić’s pressure event receives a rating of 0.040, indicating a relatively low risk and a moderate probability of ball recovery. The pass from Etxeita to the goalkeeper Werner is also under pressure from Messi, earning a rating of 0.033. Similar to the previous event, the risk is low, and the recovery probability remains modest.
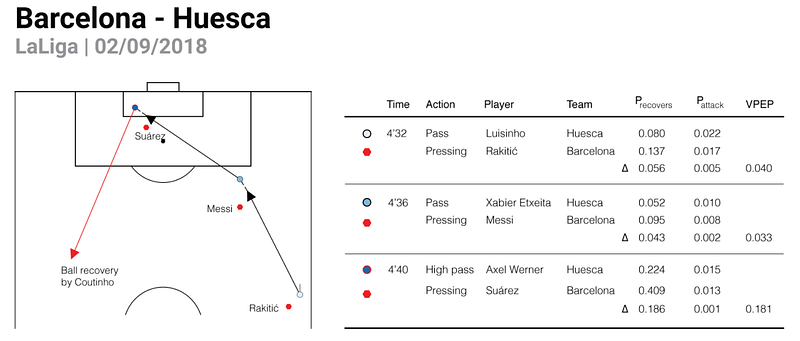
However, the most impactful pressure event in the sequence occurs when Luis Suárez presses the goalkeeper Werner. This event receives a significantly higher rating of 0.181. Suárez’s aggressive pressing strategy effectively corners Werner, leaving him with limited options. Consequently, Werner is forced to kick an inaccurate long pass, which is ultimately recovered by Barcelona’s Coutinho. The high rating for Suárez’s pressing event reflects the substantial value it adds to the team’s pressing strategy.
The example illustrates the differential ratings assigned to pressure events based on their effectiveness and impact on the opponent’s decision-making process. Events that push the opponent backward and to the sideline, while still maintaining a relatively low recovery probability, receive lower ratings. Conversely, events that effectively restrict the opponent’s options and force them into unfavorable decisions receive higher ratings.
This intuition behind the values generated by the VPEP framework provides valuable insights into the effectiveness of specific pressure events within a pressing sequence. By quantifying the impact of each event, coaches and football enthusiasts can gain a better understanding of the value added by different pressing strategies and make informed decisions to optimize their team’s defensive tactics.
Identifying the best pressing teams
In this section, the paper focuses on identifying the best pressing teams based on the VPEP metric and provides comparisons with other existing metrics. The rankings in Table 2 reveal that top teams such as Bayern Munich, Napoli, Manchester City, Barcelona, and Borussia Dortmund are consistently recognized for their pressing style. However, SD Eibar emerges as a surprising leader in the rankings. Eibar’s tactical system stands out with its high and intense wing-oriented pressing, where they crowd one wing, making the opposite end inaccessible.
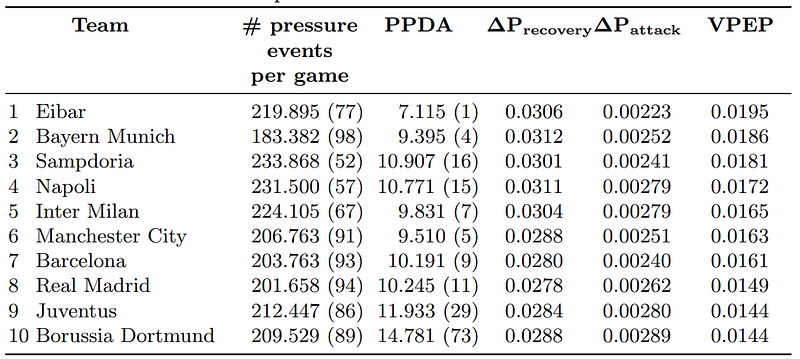
Notably, Eibar also boasts the fourth-lowest shots conceded per game among the big-5 leagues in the 2018/19 season, allowing just 8.4 shots per game. Only Manchester City, Bayern Munich, and Liverpool conceded fewer shots. This indicates that Eibar’s high press is highly effective in limiting opponents’ shot opportunities. However, it is mentioned that Eibar is vulnerable to conceding goals once their press is broken, with the shots they do concede being of high quality according to xG/shot data.
The paper also compares the VPEP metric with other commonly used metrics for quantifying pressing, such as “passes per defensive action” (PPDA). PPDA measures the ratio of passes allowed by the defending team to the total number of defensive actions, reflecting the level of defensive intensity and the frequency of pressing. The comparison reveals a strong correlation between PPDA and VPEP, where teams with low PPDA values tend to achieve high VPEP ratings. However, the metrics capture different aspects of pressing. While PPDA measures intensity, VPEP evaluates the intelligent execution of pressing. This means that teams with a high PPDA can still obtain a high VPEP score if they press strategically and effectively. For instance, Borussia Dortmund adopts a more passive defensive strategy but presses intelligently in specific situations, leading to a relatively high PPDA value but a lower rank in terms of VPEP.
By analyzing and comparing these metrics, the paper provides insights into the effectiveness of different pressing strategies and highlights the importance of intelligent pressing in addition to intensity. The VPEP metric offers a comprehensive evaluation of pressing by considering both the frequency and quality of pressure events, enabling a more nuanced understanding of a team’s pressing performance.
How fatigue affects the effectiveness of pressing
Finally, the paper explores how fatigue affects the effectiveness of pressing in football. It emphasizes that pressing requires exceptional fitness levels from players in order to effectively apply pressure and restrict the options of the opposition. The ability to sustain pressing throughout the entire 90 minutes of a match is challenging and typically requires extensive training.
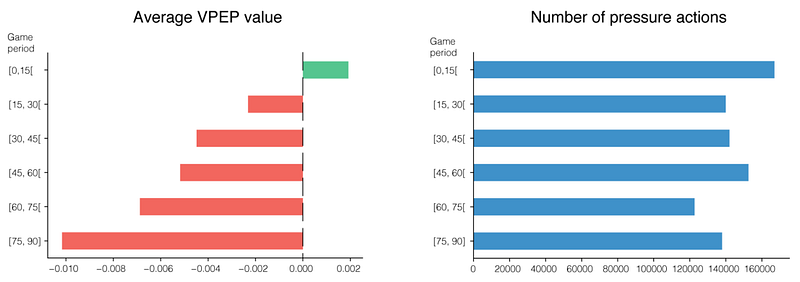
The results presented in Figure 3 demonstrate the impact of fatigue on pressing effectiveness. The average VPEP rating for all teams is analyzed and grouped into 15-minute periods, while the total number of pressure events in each period is also considered. Although the number of pressure events remains relatively consistent throughout the match, the average VPEP value decreases as the game progresses towards the end.
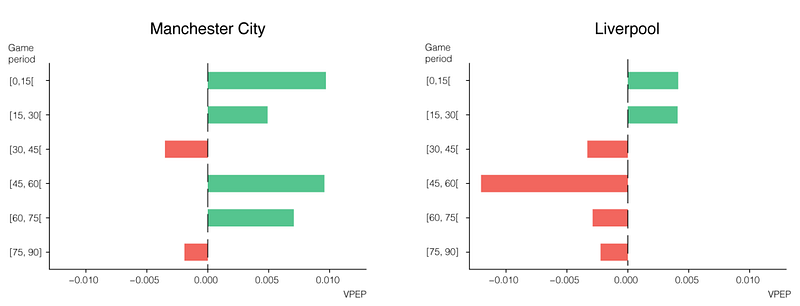
To illustrate the impact of fatigue on pressing, the paper provides an example of Liverpool under Jürgen Klopp (Figure 4). Klopp is renowned for his pressing tactics; however, the data suggests that Liverpool’s pressing intensity diminishes after the 30-minute mark. This finding contrasts with their Premier League title competitor in the 2018/19 season, Manchester City. Pep Guardiola’s team managed to sustain effective pressing throughout the entire game, with only a slight decline observed during the final fifteen minutes of each half.
These observations highlight the significance of fitness levels and training in maintaining a high-intensity pressing style. Teams that can sustain their pressing efforts without significant decline throughout the match are more likely to maintain their effectiveness and disrupt their opponents’ play consistently. Understanding the impact of fatigue on pressing allows coaches and teams to develop appropriate strategies to manage and optimize pressing performance over the course of a game.
Conclusion
In conclusion, this research paper proposes the VPEP (Value of Pressing Effectiveness) metric as a novel approach for quantifying the effectiveness of pressing in various game scenarios. Unlike existing metrics, the VPEP metric considers the contextual factors of pressing, taking into account the trade-off between the benefits of ball recovery and the associated risks to the defensive structure.
The paper highlights the limited availability of pressing-related information in event stream data. However, despite these limitations, the VPEP metric proves valuable for club analysts in assessing their team’s defensive strategy and gaining insights into the weaknesses of their opponents.
By introducing the VPEP metric, the paper contributes to the field of football analytics by providing a more nuanced and context-aware approach to evaluating pressing effectiveness. This metric can aid in decision-making processes related to defensive tactics and help teams optimize their pressing strategies based on a better understanding of the risks and rewards involved.
Overall, the VPEP metric offers a promising avenue for future research and analysis in the field of football analytics, and it has the potential to enhance the assessment and improvement of pressing strategies in the game.
References
- Robberechts, P. (2019, October). Valuing the art of pressing. In StatsBomb Innovation in Football Conference (Vol. 11). http://statsbomb.com/wp-content/uploads/2019/10/Pieter-Robberechts-Valuing-the-Art-of-Pressing.pdf


