
The Continuous Nature of Soccer: Comparing xT and VAEP for Measuring Player Contribution for Scoring Opportunities
Check out this critical comparison of two innovative methodologies, xT and VAEP, for valuing on-the-ball actions in soccer!
In this post we analyse the paper “Valuing On-the-Ball Actions in Soccer: A Critical Comparison of xT and VAEP” where 2 of tha main metrics in Football Analytics are compared. The authors are Maaike Van Roy, Pieter Robberechts, Tom Decroos and Jesse Davis from the KU Leuven Department of Computer Science.
Introduction
The paper discusses the importance of quantifying a soccer player’s performance during a match and how it can inform various decisions, including team selection, opponent scouting, and player acquisition. The paper highlights the challenge of measuring a player’s contribution in soccer due to its low-scoring nature and the limited number of on-the-ball actions.
The paper discusses the different types of performance metrics proposed by soccer analytics researchers to assess individual players’ performance, focusing on measuring the quality of specific action types in various game situations, such as shooting opportunities, off-ball positioning, passing, and set pieces. The latest research attempts to develop a unifying framework that can value a wide range of action types in different game scenarios.
The paper mentions that similar models have been developed in other sports, including basketball, American football, ice hockey, and rugby. The paper also discusses the two primary data sources used to value actions in soccer: event stream data and optical tracking data. While some work exists on valuing actions using tracking data, the vast majority of work focuses on event stream data as it is more widely available.
The paper presents an overview of three different approaches used for evaluating soccer players’ performance, namely Count-based, Expected possession value (EPV), and Action-based approaches. Count-based methods assign weights to each action type and calculate a weighted sum of the number of times a player performs each action type. EPV approaches divide the match into possessions, which are sequences of consecutive on-the-ball actions where the same team possesses the ball, and value each action that progresses the ball based on how much the action changes the team’s chances of producing a goal-scoring attempt. Action-based approaches, such as VAEP, value a broader set of actions and consider the action and game context to rate each action by estimating its effect on the short-term probabilities that a team will both score or concede.
The paper compares two canonical exemplars of the last two styles of approaches, namely expected threat (xT) and VAEP models. The authors highlight the key design choices made by each model, which yield different strengths and weaknesses. The EPV and action-based approaches are more closely related in spirit to each other than to the count-based approaches. The authors illustrate several actions where this leads to each formalism producing different valuations for particular actions. They show that the xT model is slightly more correlated with playmaking, while VAEP tends to favor shooting. Both models provide novel insights into player performance and deviate from traditional metrics like goals or assists per 90 minutes.
Overall, the paper provides a detailed comparison of different approaches to evaluate soccer players’ performance. It highlights the strengths and weaknesses of each approach and provides novel insights into player performance, which cannot be obtained from traditional metrics. The paper will be useful for researchers and practitioners interested in developing new approaches for player evaluation and for those who seek a better understanding of the strengths and limitations of existing approaches.
Action Valuing Frameworks
The paper discusses action valuing frameworks for analyzing event stream data, with a focus on soccer matches viewed as sequences of consecutive actions. The value of each action ai is calculated according to Equation (1), which captures the difference in value or quality of the game state before and after the action. The paper describes two approaches for assigning values to game states: the Expected Threat or xT model and the VAEP model.
Expected Threat
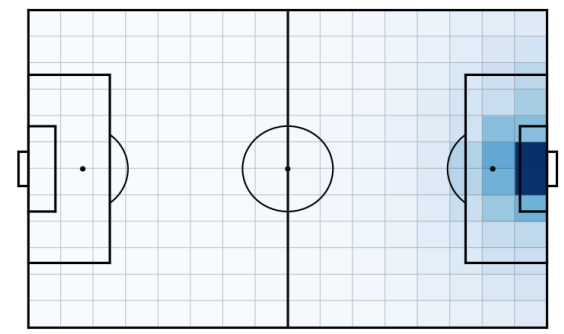
The xT model is a possession-based Markov model that divides soccer games into possessions, during which the same team has control of the ball. Each possession is further divided into a sequence of ball-progressing actions, with players aiming to move the game into a state in which they are more likely to score. The xT model represents each game state Si by considering the location of the ball on a M × N grid overlaid on the pitch. Each zone is assigned a value xT(z) that reflects how threatening teams are at that location in terms of scoring. The value of game state Si is the value of the zone corresponding to the end location of ai.
The xT model assigns xT values to zones iteratively by solving an equation that takes into account the probability of shooting, the probability of scoring from a given zone, the probability of moving the ball, and the transition matrix that defines the probability of moving the ball to each of the other zones. The model updates the xT values with each added iteration, representing the probability of scoring within the next i actions. The model values a successful action ai that moves the ball from zone z to zone z0 by computing the difference between the threat value before and after that action, as shown in Equation (2).
Overall, the xT model provides a simplified yet effective approach for analyzing soccer matches, using a possession-based Markov model and assigning values to zones on the pitch to determine the threat level of a given game state. The iterative process for updating the xT values allows for a dynamic analysis of the game state and the probability of scoring, providing valuable insights into team performance and strategies.
Learn more about xT metric here:
VAEP
The VAEP algorithm uses a more complex game state representation compared to the xT model. It considers the last three actions that happened during the game, and each game state is represented using three types of features. The first category of features includes characteristics of the action itself, such as its location and type, as well as more complex relationships such as the distance and angle to the goal. The second category of features captures the context of the action, such as the current tempo of the game, by comparing the properties of consecutive actions. The third category of features captures the current game context by looking at things such as the time remaining in the match and the current score differential.
Like xT, VAEP values an action based on how it alters the game state, but it differs in how it values each game state. VAEP estimates the probabilities that team t, which possesses the ball in state Si, will respectively score or concede in the next k actions. VAEP models the scoring and conceding probabilities separately as these effects may be asymmetric in nature and context-dependent. Hence, it trains one gradient boosted tree model to predict each one based on the current game state.
For estimating Pk score(Si, t), each game state is given a positive label (=1) if the team that possesses the ball after action ai scores a goal in the subsequent k actions. Otherwise, a negative label (=0) is given to the game state. Analogously, for estimating Pk concede(Si, t), each game state is given a positive label (=1) if the team that possesses the ball after action ai concedes a goal in the subsequent k actions. If not, a negative label (=0) is given to the game state.
VAEP estimates the risk-reward trade-off of an action by subtracting the change in the probabilities of scoring and conceding from the current state to the probabilities in the next state, where ∆Pscore is referred to as the “offensive value” of an action, while ∆Pconcede can be thought of as the “defensive value” of an action. The insight behind this valuation is that players tend to perform actions not only to increase their team’s chance of scoring a goal but also to decrease their team’s chance of conceding a goal in the near future. Thus, VAEP provides a more nuanced and context-dependent measure of the value of an action in a soccer game compared to the xT model.
Learn more about the VAEP metric here:
Comparing xT and VAEP
This section of the research paper discusses the similarities and differences between the xT and VAEP approaches for evaluating the value of individual on-the-ball actions in soccer. Both methods aim to evaluate how actions contribute to the likelihood of yielding a goal by measuring the differences in game state values before and after an action. However, xT and VAEP differ in two key aspects.
Location-based vs Feature-based
First, xT uses a purely location-based game state representation, while VAEP employs a detailed feature-based representation that captures action and game context. Second, xT is possession-based, whereas VAEP splits the game into action sequences of a fixed length and looks beyond turnovers. These design choices impact the generated action values as xT’s location-based representation limits the game dynamics that its values can capture in terms of the action types that can be valued, and the action and game context that is captured. In contrast, VAEP’s feature-based representation allows for a more detailed capture of the game context and the types of actions that can be valued.
This section discusses the differences between xT and VAEP, two similar approaches used to evaluate individual on-the-ball actions of soccer players. Both frameworks aim to measure the value of an action in terms of the resulting change in the game state before and after the action. However, xT and VAEP differ in their game state representations and how they split up the game.
xT uses a location-based game state representation, which limits the game dynamics it can capture to only ball-progressing actions that move the ball from one zone to another. It ignores defensive actions like tackles and interceptions, as well as valuable offensive actions such as take-ons within the same zone of the pitch. In contrast, VAEP employs a detailed feature-based representation that captures the action and game context, allowing it to capture a wider range of action types and the ongoing context in which actions are performed.
VAEP includes features in its model to capture the game context, such as the number of goals scored by each team, the time remaining in the match, and the score difference. This provides a more accurate evaluation of soccer situations, as the probability of scoring in a game state can depend on various factors. In contrast, xT does not consider these factors.
One advantage of xT is that its game state values are interpretable, as each game state is assigned a value based only on the location of the ball. In contrast, VAEP requires a function approximator to value game states, which means that game state values are derived from complex interactions between a large set of features. This makes it harder to explain why a particular value is assigned to a specific game state in the VAEP framework.
Possession-based vs Window-based
This section of the research paper discusses the differences between the possession-based approach used in xT and the window-based approach used in VAEP for estimating the value of a game state. xT focuses on valuing actions that move the ball from one zone to another, such as passes, dribbles, and crosses, whereas it ignores defensive actions like tackles and interceptions, as well as valuable offensive actions such as take-ons within the same zone of the pitch. On the other hand, VAEP considers the type, accuracy, and speed during the previous actions leading up to the current state to capture the ongoing context. Additionally, VAEP considers factors such as the number of goals scored by each team, the time remaining in the match, and the score difference to capture the game context.
Furthermore, the possession-based approach used in xT estimates the likelihood of any goal occurring within the same possession, whereas the window-based approach used in VAEP estimates the probability of a goal being scored within a finite number of actions. As a result, VAEP can value failed actions accurately, such as a player clearing the ball out of bounds to give their team the opportunity to escape pressing and try to recover the ball by aggressively pressing the subsequent throw-in. In contrast, xT does not consider the risks associated with taking certain actions, such as a square pass in the middle of the field that enables the other team to quickly launch a counter-attack if they intercept the ball. Finally, xT values are interpretable, as the detailed game state representation used in the VAEP framework has a cost in terms of interpretability.
Data
The paper uses data from the StatsBomb dataset for the English Premier League from the 2017/2018 and 2018/2019 seasons. The match event stream data is encoded in the SPADL format, which is a language designed for analysis that unifies the representations used by different vendors. This language facilitates analysis by representing all on-the-ball actions using the same fixed set of attributes. The XGBoost algorithm was used as the prediction method for the VAEP model. The xT model used a 16×12 grid, and convergence was reached after six iterations. After training both models on the first season’s data, they are used to rate actions in the 2018/2019 season. The availability of a publicly available converter that translates data from various providers into the SPADL format ensures the data can be used in a standardized manner. The choice of prediction algorithm and grid size for the models affects their performance, and the use of the same data for both models allows for direct comparison of their respective approaches.
Experimental comparison of action values
This section of the paper compares the performance of the xT and VAEP models in evaluating the value of specific soccer actions in different contexts. Four actions are considered: a risky backward pass in the team’s own half, recovering the ball to set up a counter-attack, a forward dribble into the opponent’s penalty box, and a through ball near the opponent’s penalty box.
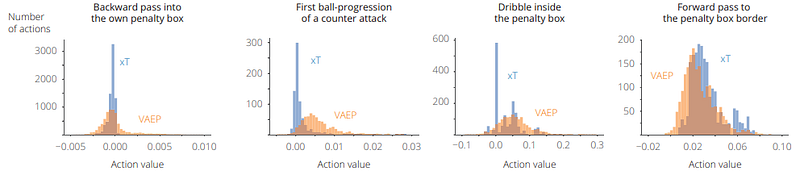
Backward passes into a team’s own penalty box
The authors note that backward passes into a team’s own penalty box are particularly risky, as losing the ball in this position may lead to a big scoring chance for the opposing team. The xT model does not capture the risk or reward of these passes, while VAEP assigns more diverse values, both positive and negative, to these passes.
First ball progression of counter attacks
Next, the first ball progression of a counter-attack is considered, which is an action that interrupts the opponent’s possession sequence and can lead to a fast counter-attack. VAEP’s more powerful reasoning on game states enables it to leverage the contextual clue of the recent recovery of the ball and assign a higher mean and variance to the distribution of VAEP values of ball recoveries in the team’s own half. In contrast, the distribution of xT values of ball recoveries in the team’s own half is extremely skewed towards zero. These results suggest that VAEP may be a more effective model for evaluating the value of specific soccer actions in different contexts than xT.
Forward dribbles inside the penalty box
Successful forward dribbles inside the penalty box occur approximately four times per game and can significantly increase the odds of scoring a goal because they move the ball closer to the goal and allow the player to maintain control of the ball near the goal. However, xT, which is used to value these actions, assigns a value of zero to a significant portion of these dribbles since it discretizes the pitch into relatively large zones. This means that many short dribbles do not move the ball into a different zone and therefore do not increase the xT value. Nevertheless, these short dribbles may still take on a defender and, when the ball is extremely close to the goal, small differences in location can considerably increase the odds of scoring.
Completed forward passes to the border of the penalty box
On the other hand, completed forward passes to the border of the penalty box, which occur roughly five times per game, can also significantly raise the odds of scoring a goal. This is because they move the ball closer to the goal and often bypass at least one player from the opposing team. However, the authors note that xT values the positional advantage gained by a through ball more than VAEP, which is another method used to value these types of actions. This may be because xT is better than VAEP at capturing the positional advantage. However, it is also possible that more information about the game state is needed to value these actions correctly, and determining the ground truth of these action values is challenging. As such, deciding which method is better suited for valuing these types of actions is not straightforward.
Experimental comparison of player ratings
In this section, the authors present an experimental comparison of player ratings obtained using xT and VAEP. The authors explain that the main application of action valuing models is to construct player ratings by summing the action values of players. The player ratings are normalized per 90 minutes of game time to account for the fact that players who spend more time on the pitch have more opportunities to contribute. The player rating for player p is computed as the sum of the values of the actions performed by the player during the time frame T divided by the number of minutes the player played during T.
The authors then compare and contrast how xT and VAEP rate players based on their top player rankings, their correlation to traditional player performance metrics, and their robustness. The authors explain that the comparison is important to evaluate the effectiveness of each method in rating players. The authors do not provide further details about the experimental design, but it can be assumed that they compare the ratings of a large number of players obtained using both methods and evaluate the extent to which they agree or disagree.
Comparison of top-25 player rankings
In this section, the authors present a comparison of the top-25 player rankings produced by xT and VAEP for the 2018/2019 season of the English Premier League. Despite some overlap between the rankings, there are notable differences between the two systems. For instance, Sergio Aguero is ranked 19th by VAEP while xT does not feature him in the top-25 list. This difference is explained by the fact that Aguero’s superior finishing skill overperforms on shots, which is a skill that is rewarded by the VAEP framework.
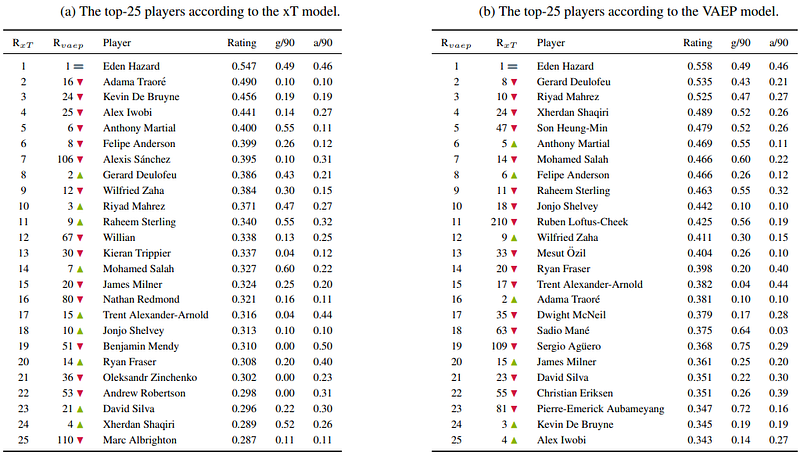
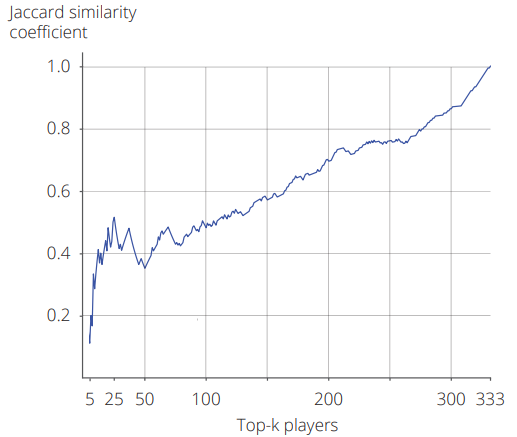
On the other hand, Alexis Sanchez is ranked 7th by xT, but he is absent from VAEP’s top-25 list. This is because Sanchez’s expected goals per 90 minutes decreased significantly during his first season at Manchester United, but he still created a similar amount of threat as he did at Arsenal. As xT does not consider shots when ranking players, Sanchez’s higher xT value is due to the fact that he completed key passes into high-value zones. The authors note that offensive players have easier access to higher ratings in both systems, which leads to a higher ranking for attacking players and a lower ranking for defensive players. Finally, the authors use the Jaccard similarity coefficient to measure the similarity between the sets of players in both rankings. The coefficient is relatively small at 0.48 for the top-25 rankings, indicating that xT and VAEP value different qualities in players. The coefficient drops to 0.35 before steadily increasing for the remaining players.
Comparison with traditional performance metrics
In this section, the paper compares the rankings produced by xT and VAEP with traditional performance metrics, such as goals and assists, which are commonly used in soccer to evaluate offensive contributions. The authors normalize these metrics for game time and find that VAEP has a stronger correlation with goals per 90 minutes (ρg/90 = 0.41) compared to xT (ρg/90 = 0.26), while xT has a stronger correlation with assists per 90 minutes (ρa/90 = 0.53) than VAEP (ρa/90 = 0.33). This is due to the fact that VAEP assigns high action values to goals, thus players who score many goals are highly ranked, while xT is biased towards creative players who complete many key passes and dribbles. However, both models fail to account for the circumstances under which the actions were performed. Therefore, while these traditional performance metrics provide some insights into the performances of individual soccer players, they do not provide a comprehensive evaluation of player performance.
Robustness
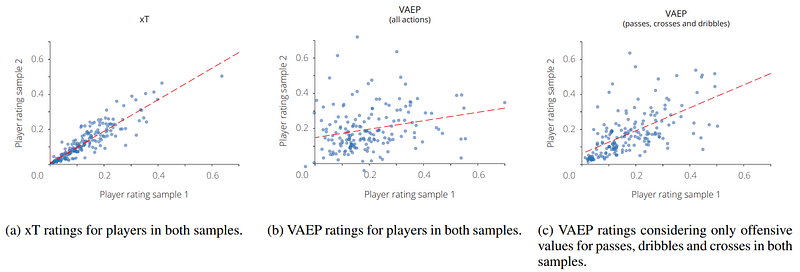
In this section of the research paper, the authors investigate the robustness of two rating systems, xT and VAEP, in capturing the true quality of all players over the course of a season. The authors split the data into two random subsets and compute each player’s average rating separately for both subsets, then evaluate the Pearson correlation between both. The xT model achieves a much stronger correlation (ρ = 0.89) than the VAEP model (ρ = 0.25). However, when only the ball-progressing actions that are valued by the xT model are included, and when only the offensive value of actions is considered, VAEP achieves a correlation of ρ = 0.59.
The authors suggest that the ratings produced by the xT model are more robust than the ones from the VAEP model, even when adjusting for the different actions and risk (i.e., defensive value). The differences in robustness between the two models can be attributed to two factors. First, because VAEP assigns high action values to goals, the aggregated ratings can vary significantly based on whether or not these goals are included. Second, since players are consistent in what type of actions they perform at which locations, a metric purely based on zonal changes gives consistent results. The VAEP ratings add more context and therefore allow more variation.
Overall, the robustness analysis provides evidence that the xT model is better at capturing the true quality of all players over the course of a season. The xT model achieves a strong correlation between the ratings obtained from different random subsets of the data, indicating that it is less susceptible to fluctuations in performance that may be attributable to luck or other random factors. This is an important result for the development of accurate and reliable player rating systems in soccer.
Conclusion
In this research paper, the authors conducted a critical comparison of two prominent approaches, xT and VAEP, for valuing actions in a soccer match. The comparison was done conceptually, qualitatively, and quantitatively. The authors found that key differences arise in how each approach represents the game state and what actions are valued. VAEP was found to better capture the risk-reward tradeoff of actions, while xT was found to be more robust. However, both metrics produce rankings that deviate from those produced by considering traditional metrics (goals or assists), providing additional insights into player performance. The authors also found that both metrics have their own strengths and weaknesses, which should be considered when choosing a metric for a particular application. Overall, the findings of this study provide valuable insights into the use of xT and VAEP for valuing actions in soccer matches and their potential applications in player performance evaluation and team strategy development.
References
- Van Roy, M., Robberechts, P., Decroos, T., & Davis, J. (2020). Valuing on-the-ball actions in soccer: a critical comparison of XT and VAEP. In Proceedings of the AAAI-20 Workshop on Artifical Intelligence in Team Sports. AI in Team Sports Organising Committee.


