
Trending GitLab Data in Prometheus
At work we switched over to GitLab earlier this year and through that we have had to migrate from a few different tools and processes and have tried to centralize on GitLab as much as possible. I wrote about a few of the things I did to migrate us in from bringing in issues from Jira and epics from Aha and our usage of a GitLab Triage bot
GitLab does some really good things and is really not great at some others. Reporting and trending is one area that it is not so great at (well at least with our usage).
We tried to use Insights but with the way our team works; split into 2 teams ( frontend and backend) and working across 3 different projects at a time. Each project has multiple repos. Couple this with the fact that in GitLab an issue (ticket) is only either open or closed the rest is handled with labels, it just did not provide us with the data we needed.
The First Solution
I had already created a Slackbot to interface with GitLab so users could look up their issues and interact with them in a bit cleaner way than the default GitLab Slack integration. So using that work I decided to create a slash command that allowed us to get an idea of what is going on with a sprint and pull info such as:
- How many issues are assigned to each team member
- What is the current weight assigned to each team member
- Issue count by status (aka labels in GitLab)
- Breakdown of Estimated Time vs Time Spent by team member
- This could be done on a per team basis or summary of the teams combined
This worked really well but had an issue of not being able to adequately trend data out visually. It could look at this Iteration (sprint) or last and yes, I could have coded a broader look but still no charts.
The bigger issue was that as a company we decided to migrate off of Slack back to Teams. Writing Teams bots/hooks did not seem like a task I was all that interested in taking on.
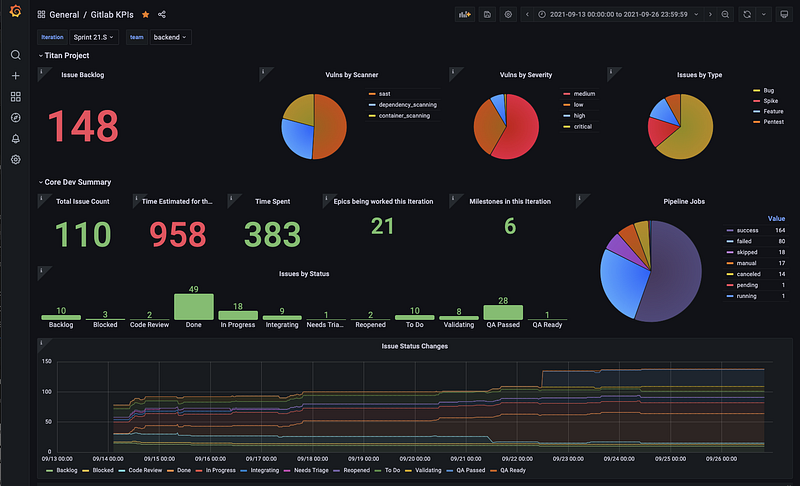
Enter Prometheus and Grafana
As we launch our new platform we have been looking at using Loki, Prometheus and Grafana for internal telemetry which has been amazing so far. So why not add GitLab data to the mix as well!
Grafana Enterprise has a Grafana datasource for GitLab which may already do this but I am not sure. However, since I already had the python slack code written it was easy enough to make it spit out Prometheus data instead of Slack messages!
From there the number of metrics has exploded as we have realized that we can pull the data that we actually need and want to display. We can also do trending and snapshot in time graphs.
Having this has really helped us better sprint planning and dealing with unplanned work that has come in mid-sprint.
List of Metrics
Below is a list of metrics that are currently supported by the code, the majority of these are broken down by team. Note, we are a GitLab Ultimate subscriber so have access to Iterations so most things are broken down by iteration as well.
- Issue Weight by User
- Issue Counts by Status (aka label)
- Time Estimated by User
- Time Spent by User
- Issue Count by User
- Issue moved to Engineering Complete by User
- Ticket Closed by User
- Number of issues in the Backlog
- Number of issues in the iteration
- Total Iteration issues weight
- Iteration weight by label (status labels)
- Time Estimated during Iteration
- Time Spent during iteration
- Time Estimated during Iteration by label (status labels)
- Time Spent during iteration by label (status labels)
- Issues by Classification Count
- Issue Count by Severity
- Issue Count by Priority
- Issue Count by Milestone
- Issue Count by Epic
- Current Release and Release Date
- Vulnerability Counts by Severity
- Vulnerability Counts by Scanner
- Vulnerability Counts by Scanner and Severity
- Summary of Build status across all projects
- Build status broken down by project
Give me the Code Already!
The code lives in my GitHub repo. It was designed to run in one of our Kubernetes clusters but can run as a docker anywhere. Currently I am building and deploying via GitLab CI/CD. The container itself runs FastAPI and serves out metrics on /metrics.
The code will look for a config file in a repo so you will need to either define a .env file or environment variables in your Kubernetes setup for GL_ACCESS_TOKEN, CONFIG_FILENAME, CONFIG_PROJECT_ID and CONFIG_BRANCH. Of course if you want to keep the config in the container you can certainly just define the CONFIG_MAP to have the JSON from the config.json file in main.py.
If you want to turn off certain metrics you can by setting them to 0.
Hopefully you find this all useful, if so give me a Clap or a Star on Github!


