
Top 4 Python libraries for technical analysis
With an example of calculating Bollinger Bands
Nowadays, more and more people are interested in finance and investing. One of the sub-fields of that wide domain is technical analysis. Wikipedia defines it as
[…] an analysis methodology for forecasting the direction of prices through the study of past market data, primarily price and volume.
The increased interest in technical analysis (TA) also resulted in the creation of multiple libraries used for it, for pretty much all modern programming languages. In this short article, we cover the top 4 Python libraries.
Setup and data
Before we start calculating technical indicators, we need to prepare a bit. First, we import the required libraries. The only one that might be tricky to install (or at least not as simple as running pip install) is TA-Lib. I will refer you to the library’s GitHub repository for more information on the installation process.
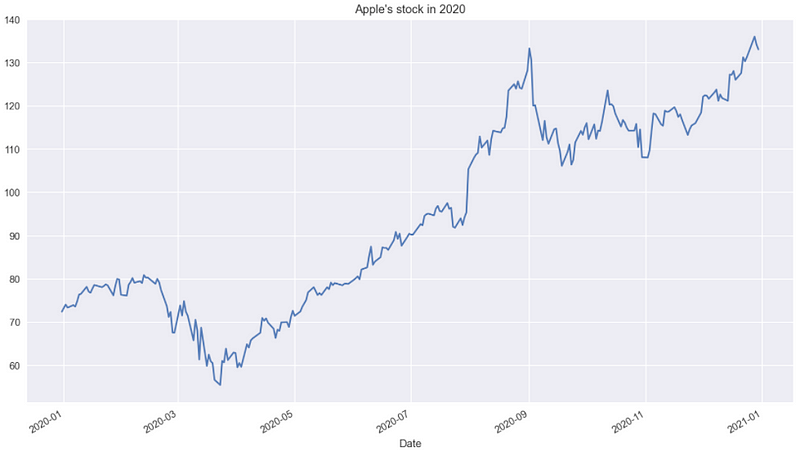
Then, we download Apple’s stock prices from 2020 using yfinance. I have already covered the library in one of the previous articles.
Without further ado, let’s proceed to explore the TA libraries.
Top 4 TA libraries
The ranking below is based on the number of GitHub stars, collected in early November 2021.
In the list below, we mention the noteworthy characteristics of each of the libraries and show how to calculate the Bollinger Bands (a popular TA indicator) using each one of them.
1. TA-Lib - 5.8k stars
GitHub repo: https://github.com/mrjbq7/ta-lib
TA-Libis a Python wrapper for TA-LIB,- de facto the golden standard when it comes to calculating technical indicators,
- it includes 150+ indicators,
- it also has functionalities for detecting patterns in candlesticks,
- installation is not as simple as
pip install, - unfortunately, reading the documentation can be a bit of a pain.
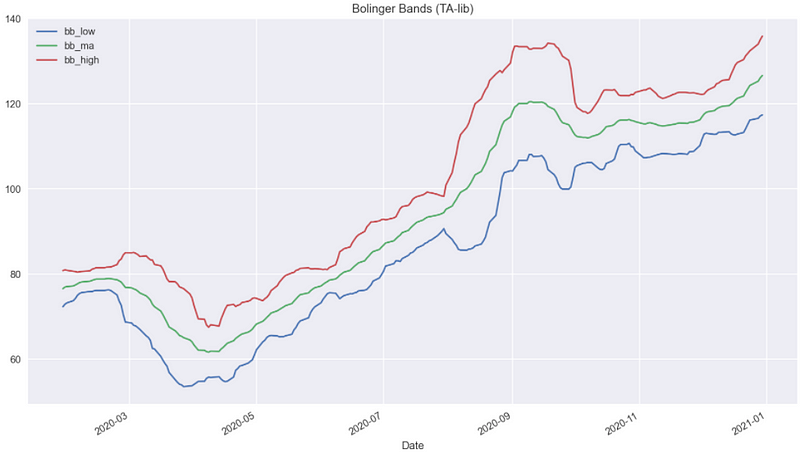
In the snippet below, we calculate the Bollinger Bands and plot them. We had to specify the timeperiod argument (number of days used for calculating the rolling average and standard deviation), as the default value is 5, as opposed to the commonly used 20.
2. ta - 2.5k stars
GitHub repo: https://github.com/bukosabino/ta
- built entirely using
pandasandnumpy, - the library offers 42 indicators.
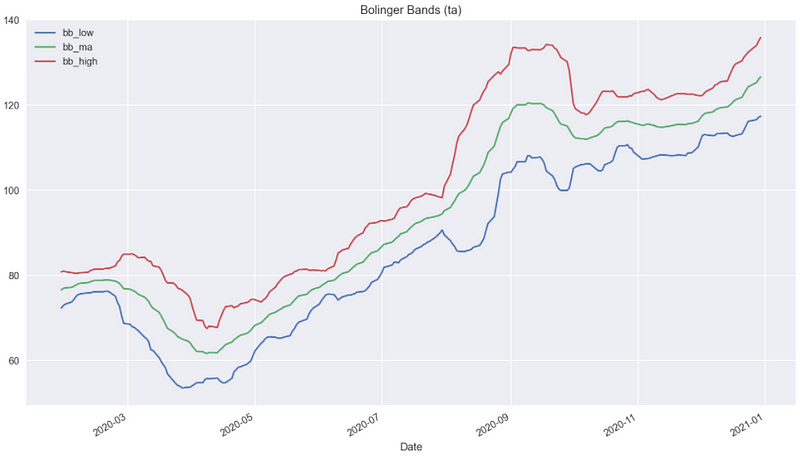
Using the snippet above, we calculate the Bollinger Bands and plot them. The results are the same as using TA-Lib.
ta additionally contains some more functionalities when it comes to Bollinger Bands.
First, it can calculate trading signals. For example, when the close price is above the upper band. Second, the library can also calculate the width between the bands (the wider the more volatile the price) and the %B Indicator. The indicator is calculated as
%B = (Price - Lower Band)/(Upper Band - Lower Band)You can read more about it here.
Lastly, the library contains a very useful function used for calculating all available TA indicators using a single line of code. For example, we can use it when we want to generate a lot of different indicators for our ML model.
Using the command above, we generated 83 columns with different TA indicators (the other 6 are the original data downloaded from Yahoo Finance).
3. pandas-ta - 1.8k stars
GitHub repo: https://github.com/twopirllc/pandas-ta
- built on top of
pandas, - contains 130+ TA indicators and utility functions,
- when TA-Lib is installed, the
pandas-tacan use it for calculations and then also offers candlestick pattern recognition, - contains a
Strategyclass which is a simple way to name and group the selected TA Indicators by using a Data Class.
In the snippet below, we calculate the Bollinger Bands using pandas_ta. As mentioned above, the library can use TA-Lib, but we can easily turn that functionality off.
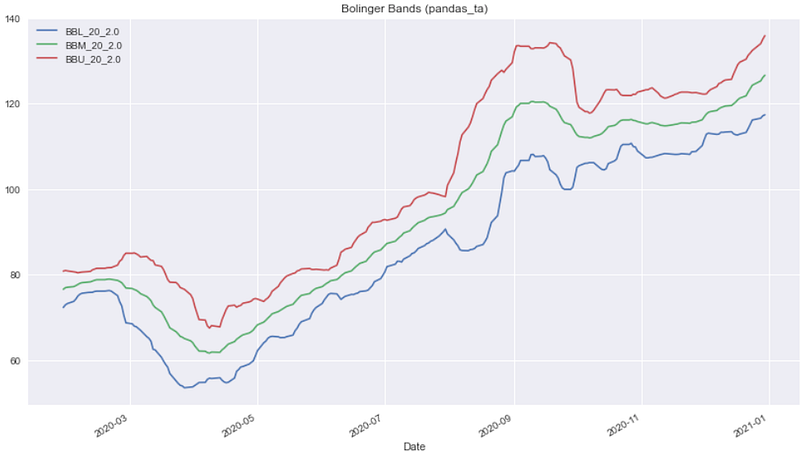
Similarly to the ta library, the function in pandas_ta also returns the width between the bands and the %B Indicator.
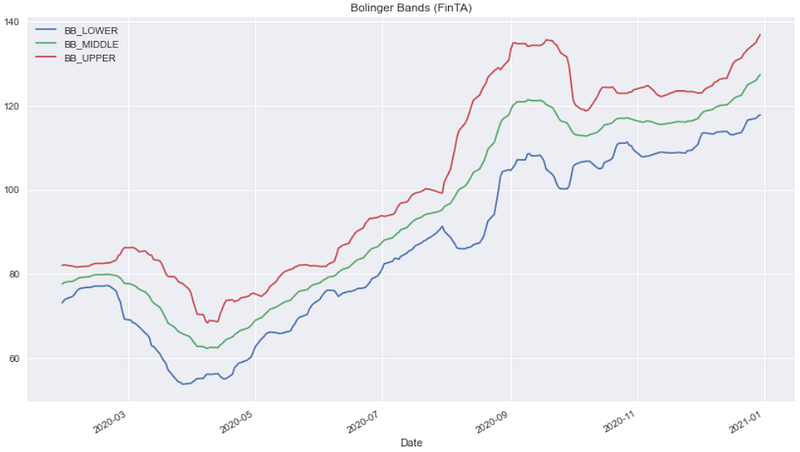
4. FinTA - 1.3k stars
GitHub repo: https://github.com/peerchemist/finta
- built on top of
pandas, - the library offers 80+ TA indicators.
Just as we have done before, we calculate the Bollinger Bands using the FinTA library.
Takeaways
- with the increasing interest in finance, there are a lot of interesting libraries dedicated to technical analysis,
- TA-Lib is the golden standard, but it is not the easiest one to understand and dive deep into,
- the libraries based on
pandasandnumpyoffer a good learning experience as we can easily follow the operations done on the input data.
You can find the code used for this article on my GitHub. Also, any constructive feedback is welcome. You can reach out to me on Twitter or in the comments.
Liked the article? Become a Medium member to continue learning by reading without limits. If you use this link to become a member, you will support me at no extra cost to you. Thanks in advance and see you around!
You might also be interested in one of the following:


