

The Stata Frames Guide
(last updated: 16 Sept 2023)
The ability to use frames in Stata is arguably one of the most important features added to the software. Introduced in version 16, frames essentially allow us to hold multiple datasets in memory, and work across them. This has considerable advantages over using single, very large datasets, or moving in and out of datasets using the preserve and restore options. For example, assume we have data on students (100k observations), teachers (10k obs), and schools (1k obs). If we merge all this data together (a one-to-many merge), then we will end up multiplying the observations in the teachers dataset by 10, and the schools by a 100. This also implies that each variable in the teachers and schools dataset is repeated for each corresponding student row. This creates an unnecessarily large dataset, that is a burden on the memory that can considerably slow down calculations. Frames allows us to keep the datasets in their original form, and we can create “links” between them either as a 1:1 or a m:1 merge (1:m is not currently supported). For very large datasets, we are talking about immense memory savings and efficiency gains.
The frames feature is not unique to Stata. It has long existed in other languages including R and SQL. But being a relatively new feature in Stata, few use it or understand its importance. In short, frames are really worth the investment, and this guide will cover the basics.
Just like other guides, it is assumed that you have access to at least Stata 16, and understand basic Stata syntax and can work your way around code snippets. This guide is more of an introduction to Stata frames. Always check the help files for full documentation. Several useful links are provided at the end of the guide for additional reading. Stata accepts frames and frame as interchangeable commands, so I also use them liberally below.
Introduction
First of all, any data loaded in Stata 16 or higher, is loaded in a frame:
sysuse auto, clearThe default frame is called exactly that, “default”. We can check it by typing:
framesWe can, of course, rename the frame:
frames rename default corewhich follows the standard logic frames rename <oldname> <newname>. You can check again by typing:
framesThis will tell you which frame you are currently working in and what it’s called.
Application 1: Data subsets as frames
If we need to manipulate some variables (or destroy raw data), especially if their core structure changes, we can push the variables that we want to experiment with into a new frame:
frames put make price mpg, into(mysubset)Here we copy three variables: make, price, and mpg in a frame titled “mysubset”.
At this point, we have two frames, the “core” which contains all the data, and “mysubset”. We can check what all frames exist by typing:
frames dirand we will get this output:
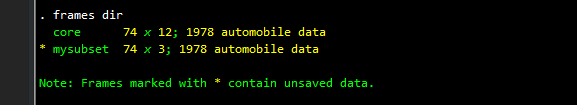
Here it shows that we have two frames, their dimensions in rows x columns, or observations x variables, and their label. The * implies unsaved data frames.
Since we are currently in the “core” frame, we can change the frame as follows:
frame change mysubsetHere we switch to the other frame and we will see the three variables that we have copied. Switching is not really necessary. We can call other frames which staying in the “core” frame. Let’s try it out. First let’s switch back to the core frame:
frames change coreand let’s summarize the variables in “mysubset”. For an overall summary, the following command gives a broad overview:
frames mysubset: describe
frames mysubset: summarize
These are just the standard describe and summarize commands for a specific frame. We can operate on variables in another frame as follows:
frame mysubset: summ pricewhich is a line-by-line option. Otherwise, can also use code blocks:
frame mysubset {

 foreach x of varlist _all {
  summ `x'
 }
}
This simple example shows how operations can be performed using the frames block:
frame <framename> {
   some stata commands
}
This makes doing a bunch of calculations much easier. The logic is similar to calling Mata if you are already familiar with its programming structure. If not, an introduction to Mata is provided in this guide.
Application 2: Uses of frames
In terms of applications, frames are not just useful for data subsets. We can also copy the original data as it is:
frames copy core mycopy, replacewhere we generate a frame titled “mycopy” with the original data replicated. The replace option is optional but it overwrites the frame if it already exists. So use it carefully!
We can also generate an empty data frame:
frames create otherdata // create an empty frameand load some other data set inside:
frames otherdata: sysuse censusIf you have tried all the above commands, we should have four frames now:
frames dir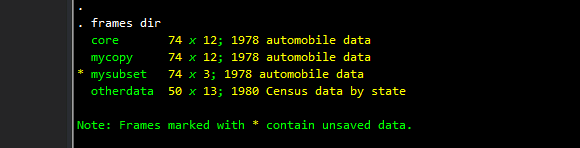
And we get a neat summary of all the frame types:
The “core” frame, a copy of the main data set saved in “mycopy”, our subset of three variables stored in “mysubset”, and the other dataset that we loaded in “otherdata”.
We can also clean up and drop frames. For example:
clear frames
or
frames resetwill just clear everything and revert to a single “default” frame. If you are using frames a lot, it is also advisable to add clear frames to your dofiles together with other initialization options:
clear
clear frames
clear mata
cd "<my directory>"etc.
We can also drop individual frames by typing:
frames drop mycopywhich will drop the “mycopy” frame from memory. Just like working with matrices and Mata, it is very easy to create data “junk”. So make sure to drop stuff or clean it up where necessary. While the gains might be very marginal on small (<10,000 observations), one can feel the difference with very large data sets.
Application 3: Storing summary statistics in frames
We can also generate a data frame which we can use for storing some information. For example, summary statistics that we can later use for graphs, tables etc.
Let’s start with a simple example, where we want to take the “core” data, summarize each variable, and store its mean and standard deviation in another data frame. We also want to automate the process and select only the numerical variables. Let’s start with a clean slate:
clear
clear frames
sysuse autoLet’s create an empty frame with the variable names and format type:
cap frame drop substatsframes create sumstats str15(variable) mean sdHere we are create three variables in the “sumstats” frame. A string variable called “variable”, and two numeric variables “mean” and “sd”. Note if you want more precision you can also type:
frames create sumstats str15(variable) double(mean sd)where we also define the numeric variable types to be double.
If you now type:
frames diryou should get the following output:
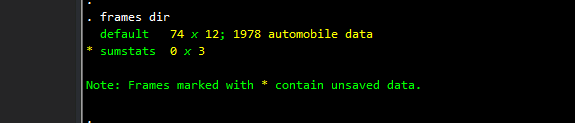
We have an empty “substats” frame with three columns or variables. Now let’s pick all the numerical variables, summarize them, and store the information in the “sumstats” frame:
// pick variables which are numeric ds, has(type numeric)
local mylist `r(varlist)'// loop and store information
foreach x of local mylist {
qui summ `x'
frame post sumstats ("`x'") (r(mean)) (r(sd))}
Note the use of frame post. It has to take the following format when posting:
frame post <framename> (var1) (var2) (var3)This format can be used to post any bunch of statistics. Since we start with zero observations, each frames post essentially adds an observation row.
We can view the dataset we have in the new frame:
frames change sumstatsand then br and we get a nice table of the numeric variable name and its mean and standard deviation:
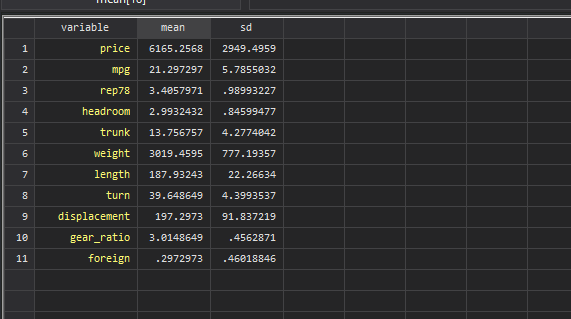
Here, I would like to point out that there are two risks one should be aware off when using the frames post command. First, as far as I know, this type of frame posting is restricted to the number of variables you have. You can post less or equal but not more than the variables you have defined. So the variables have to be defined carefully and in the right order when creating a frame. Stata will not know that the mean should go in the mean column automatically. This might take some iterations to figure out exactly what you need, and in which format. Second, frames post is an append command, so if you rerun the loop, you are essentially adding duplicate observations and no errors will be returned. That is why in a program or in a dofile, it makes sense to drop the frame, define the variables, and run the loop in one go so you ultimately end up with the correct data in the frame.
Application 4: Storing regression results in frames
This usage of frames also has considerable advantage when dealing with regressions or estimation commands. While Stata’s built-in regressions are fairly standardized in the type of information that is stored, either in e-class or r-class locals, it is not the case for user-written commands which can vary considerably. But what is definitely possible is to somehow recover the estimates (depending on how well the command is coded), mostly beta coefficients, standard errors, and/or confidence intervals, after running some estimation, and post them in a frame. Let’s say this frame is called “results”, which contains beta coefficients and standard errors. This keeps the content of the “results” frame neat and clean, irrespective of how the estimated were generated and recovered. Additionally, for plotting or generating tables from results, we can switch to the “results” frame, rather than saving and switching to some data file that contains the results information we need.
Let’s try a basic regression example where we want to store results of different regressions. Let’s use a default Stata panel data (from the xt manual):
clear
clear frames
webuse nlswork
xtset idcode year
gen age2 = age^2
gen black = (race==2)Let’s say our core specification is the following:
xtreg ln_w grade age age2 tenure black southand we want to run different models that deal with fixed effects, random effects, MLE, etc. We can create an empty “results” frame that contains variables that we want to extract, for example, model type (string), variable name (string), its coefficient (numeric) and standard error (numeric):
cap frame drop results
frame create results str15(model variable) mean se
From the previous example, we know that anything we “put” in the frames has to be a line-by-line operator. Matrices or a bunch of variables cannot be passed on to frames in a single instance (maybe this might change in the future). So we need to loop over all the variables. We can start off by storing all the variables in a local:
local varlist "grade age age2 tenure black south"and run the regression and pass the results to the “results” frame:
local varlist "grade age age2 tenure black south"xtreg ln_w `varlist', reforeach x in `varlist' _cons {
frame post results ("re") ("`x'") (_b[`x']) (_se[`x'])
}Since we are using a local, the whole code block needs to run in one go. The foreach loops over the intercept and the variables, and the frame post option, which requires four inputs, adds the information in the “results” frame. The first two inputs are strings, while the last two are beta and standard error estimates recovered from Stata locals.
We can add the remaining two models as well:
local varlist "grade age age2 tenure black south"// Fixed-effects modelxtreg ln_w `varlist', fe
foreach x in `varlist' _cons {
frame post results ("fe") ("`x'") (_b[`x']) (_se[`x'])
}// Random-effects model using MLExtreg ln_w `varlist', mle
foreach x in `varlist' _cons {
frame post results ("mle") ("`x'") (_b[`x']) (_se[`x'])
}The above commands should push the results in the “results” frame. We can now explore the frame as well:
frame change resultsand then type br and to see this neat summary table like this:
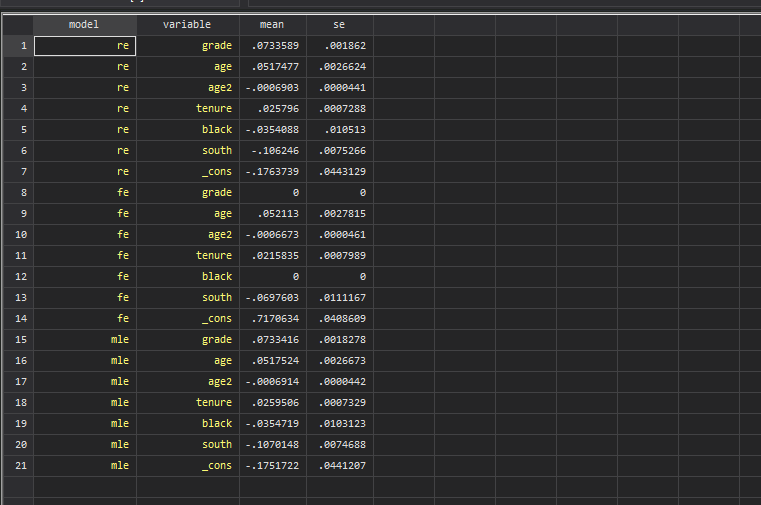
It also works with reghdfe (ssc install reghdfe, replace) which is used as a wrapper for several estimation commands:
frame change defaultlocal varlist "grade age age2 tenure black south"reghdfe ln_w `varlist', absorb(idcode year)foreach x in `varlist' _cons {
frame post results ("reghdfe") ("`x'") (_b[`x']) (_se[`x'])
}So above we learned how to push results for various estimates into frames using a bunch of loops. Not very efficient but a lot of possibilities exists to do interesting things with this setup.
Some additional points:
- Passing all the coefficients to frames is not necessary. If there is just one coefficient of interest, for example, some ATT value we want to track, then the above process is far easier since we just need to push one variable to the data frame for each regression type.
- If we want additional information from
r(table)or other e-return variables, we can manually push them to Stata by using the correct indices:
xtreg ln_w grade age age2 tenure black south, re// see the r(table) output
mat li r(table)// indices for the first independent variable
di r(table)[1,1] // mean
di r(table)[2,1] // sd
di r(table)[5,1] // (lower CI)
di r(table)[6,1] // (upper CI)// generate an empty frame with the info we needcap frame drop indextest
frame create indextest str20(variable) mean sd ll ullocal varlist "grade age age2 tenure black south"
xtreg ln_w `varlist', relocal i = 1foreach x in `varlist' _cons {frame post indextest ("`x'") (r(table)[1,`i']) (r(table)[2,`i']) (r(table)[5,`i']) (r(table)[6,`i']) local i = `i' + 1 // increment the counter
}frame change indextestHere we essentially run a counter which pick the variables from the r(table). This can be made more elegant but it all depends on what we want to recover.
3. Results can also be pushed onto different frames. This allows us to simply convert the r(table) matrix to a dataset and store all the information. This might be easier in some cases:
// check the frames
cap frame change default
cap frame drop allcoeffs
// just create an empty frame
frame create allcoeffs// run the regression
xtreg ln_w grade age age2 tenure black south, fe// store the r(table) and transpose it
mat mymat = r(table)'
mat li mymat // just for viewing// dump the matrix in the frame using svmat2 (allows row names)
frame allcoeffs: svmat2 mymat, names(col) rnames(variables) // check what it looks like
frame change allcoeffsThe above examples are just provided to give some examples of the usage of frames when dealing with data and results. In summary, without frames, we would have to store the results somewhere (either in a matrix, or in a temporary data file), load them and replace the original data and work on some regression or table output. By pushing the results on to different frames, we can parallel process the two without modifying the datasets over and over again. Note that here we make use of svmat2, a command by the prolific Nick Cox (ssc install svmat2, replace) which also stores row names.
Application 5: Linking frames
So how about linking frames? This is an important features of frames. As mentioned in the introduction, frame links allow us to combine different level of datasets without having to merge everything in one big file. Here I will show some simple example using 1:1 links. But the logic can be extended to work with a m:1 merge. Since 1:m merge is not currently supported, it is also advisable to start with the finer-level dataset as the default frame.
Let’s start with a simple dataset:
clear frames
sysuse auto, clear
Let’s generate a unique id variable:
gen id = _n
order id
What we will do now is copy the id variable in a new data frame called “otherdata”:
frame put id, into(otherdata)We can generate some random variables in the new frame:
frame otherdata: gen var1 = rnormal()
frame otherdata: gen var2 = runiform()
frame otherdata: gen var3 = runiform()
frame otherdata: gen var4 = runiform()
which are a randomly distributed variables. We want to link out main “default” frame with “otherdata”. This is defined through a merge-like option:
frlink 1:1 id, frame(otherdata)Since we know it is a 1:1 match, all the observations will be linked. This can of course be replaced with m:1 merge. Additionally the merge can be defined on several variables as well. We should get an output that looks like this:
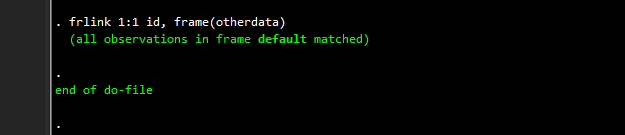
Here we will also get a new variable that is called “otherdata”. This is actually the variable name that defines the link (and Stata should label it with some indicator). As a note of precaution, do not touch this variable! The only things allowed are renaming it or labeling it.
In case you modify or change datasets in frames, then it is safe to rebuild the link:
frlink rebuild idIf we rename the “otherdata” frame then the link also has to be generated again:
frlink 1:1 id, frame(otherdatawithnewname)The Stata help actually list several scenarios on where and how frame links can be very useful especially when working with complex data construction:
help frlink##examplesWe can see the link properties as follows:
frlink describe otherdata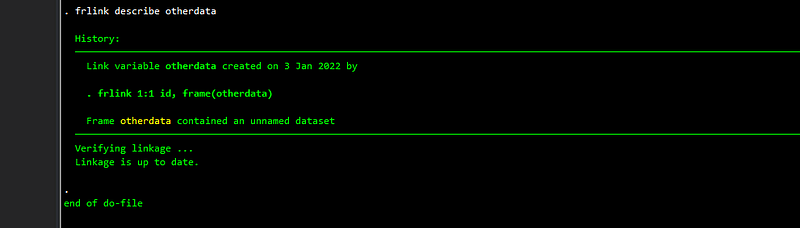
And we get this summary on when and how the link was created. What is important is that this command verifies the link and makes sure everything is in order. This is important because we have temporary datasets in frames that might be modified. Just to reiterate, rebuild links if you are not sure.
We can drop links by simply dropping the variable:
drop otherdata Again, this should be a bit more intuitive or at least have a frlink drop like option. But since these are new features, they are also constantly evolving. What we can definitely do, is generate our own link variable:
frlink 1:1 id, frame(otherdata) generate(_link_otherdata)Here I name the variable _link_otherdata which makes it easier to read and identify. But feel free to use an other logical convention or you can even stick to the default name.
While frlink looks similar to the merge command, it has an additional advantage. Frames allow merging on different variable names. In our example above, if we had id as the unique identifier in the main dataset, and, let’s say, carid in “frame1” that we want to merge with, then we can just type: frlink 1:1 id, frame(frame1 carid). This is powerful option and provides a lot more flexibility. But if you are building a large network of datasets, make sure to track what is linked with what. Ideally, there should be an order to merge variables.
Another note: frame links are a one-way street. This means that if frame1 is linked to frame2, it does not imply that frame2 is automatically linked to frame1. This would require different frame link. Additionally all links have to be generated with the main data frame that you are working on. So if we map frame2 to frame3, and then frame1 to frame2, it does not imply that frame3 is automatically linked to frame1. Again this will be useful feature to have but currently frame linking is done directly.
Playing across links
Now that we have linked the frames, we can also use them interactively to get data and do other calculations. Data from other frames can be extracted using the frget or fralias (new in v18) command. It also comes with various options:
// copy the variables as they are
frget var1 var2, from(_link_otherdata)
// copy and prefix the variables
frget var1 var2, from(_link_otherdata) prefix(copy_)// generate a new variable
frget newvar = var1, from(_link_otherdata)Note that here we put in the link variable name in the from() option.
We can also use the data interactively for some (but not all) operations using the frval option:
gen newvar2 = price / frval(_link_otherdata, var1)We can also use frval in if and in conditions:
regress price mpg// condition on values in linked frame:
regress price mpg if frval(_link_otherdata, var1) < 0.5This can have considerable advantages for controlling data subsets without having to copy everything over.
The frval cannot be used directly inside regressions for example we cannot say regress price frval(_link_otherdata, var1). Here one would need to copy the variable first before using it in regressions.
But rather than copying the data over, we can also just create an alias to variables in other frames:
fralias add var3, from(_link_otherdata)We can also add multiple variables:
cap drop var3
fralias add var3 var4, from(_link_otherdata)
Here we can also use wildcards, prefixes, postfixes etc. This new feature also makes life a little less complicated by allowing us to direct use the names:
gen newvar3 = price / var3
regress price mpg var3
without having to duplicate any data.
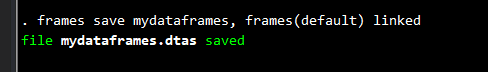
Lastly, if we have a bunch of frames that are linked, we can also save the datasets together with their linkages as follows (introduced in v18):
// v18 save options
frames save mydataframes, frames(default) linked replace
Here we need to defined the main frame that is linked to other frames. The linked option suggests to save the linked datasets as well.
Even if the frames are not linked, we can save them as a collection:
frames save mynewdataframes, frames(default otherdata) replaceThis will save the information in a new .dtas file format:
Even if we reset everything, we can restore and recover the data:
frames reset
frames describe using mydataframes
frames describe using mydataframes, simple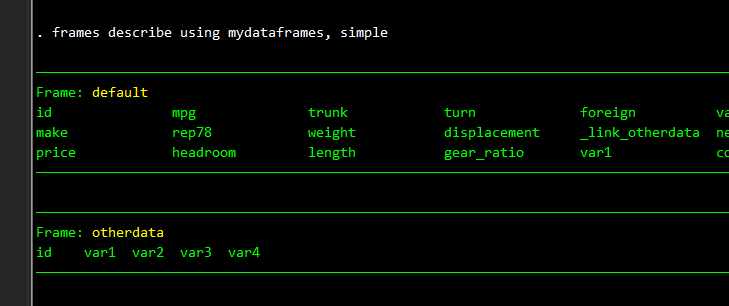
We can also restore everything using:
frames use mydataframesThese options open up a lot of possibilities to optimize workflows. More specifically, if a team is working on large datasets, which let’s say one group is responsible for one set of surveys, such as schools, and another is doing teacher surveys, while a third is doing household surveys, then each can independently work on their own datasets, while the main data manager can create and build checks and analysis, across the different data sources without having to create exceptionally large files. Using frames in such checks can also be useful to avoid importing or linking complete datasets.
But are frames always useful? The short answer is, it depends. If you have 1:1 datasets, better merge them if you are not changing the raw data. You don’t have to force frames in to your data structure. Plus frames in Stata are a relatively new feature that are still being developed. Hence the learning curves might still be high as features change, get upgraded, or new features are added. But definitely frames are an important tool to enhance workflows.
Other readings
Few articles exist on Stata frames. So I would first of all recommend the introduction to frames in Stata help:
help frames introThen read “Fun with frames” on the official Stata blog:
and another article (with the same name!):
StataCorp released a new guide in 2023:
See this Twitter thread by Jan Kabatek, who works on very large administrative datasets:
Jan, also shows how using frames can also provide massive speed gains when generation graphs on his GitHub page.
Another Jan, Jan Ditzen, has released frame-based commands to parallelize Monte Carlo simulations in Stata. You can see the thread on Statalist here. Also check his GitHub page for various Stata commands that deal with multi-processing.
About the author
I am an economist by profession and I have been using Stata since 2003. I am currently based in Vienna, Austria. You can see my profile, research, and projects on GitHub or my website. You can connect with me via Medium, Twitter, LinkedIn, Mastodon, or simply via email: [email protected]. If you have questions regarding the Guide or Stata in general post them on The Code Block Discord server.
The Stata Guide releases awesome new content regularly. Subscribe, Clap, and/or Follow the guide if you like the content!


