Store Sales Forecasting Application with Streamlit

Introduction
This article focuses on the use of Streamlit to build an application for a store sales forecasting model. The processes are similar to the customer churn application that was built with Gradio in my (Article).
What is Streamlit?
Streamlit is an open-source Python framework that allows data scientists and machine learning engineers to create interactive and user-friendly web applications quickly and easily, without requiring knowledge of web development.
Streamlit Features
- Easy-to-use API: it has a simple and intuitive API that makes it easy for developers to create interactive applications without needing to know web development. They include: Input widgets, text elements, layouts and containers, chart elements, status elements, etc. ( Streamlit API Reference )
- Real-time updates: Streamlit automatically updates the output of the application as the user interacts with it, without requiring the user to refresh the page.
- Built-in layout and styling: it has built-in templates and layout options that make it easy to create visually appealing applications without having to write custom CSS or HTML.
- Integration with popular data science libraries: it integrates with popular Python libraries such as Pandas, Matplotlib, and Scikit-learn, making it easy to create interactive visualizations and machine learning models.
- Sharing and deployment: it also provides easy options to share and deploy your applications with others. You can deploy your application on various platforms like Heroku, AWS, and Google Cloud.
Overview of the Store Sales Forecasting Model
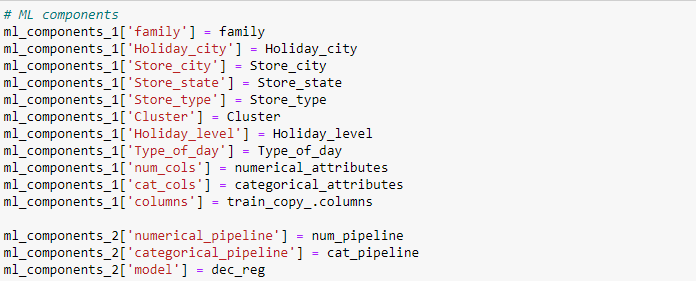
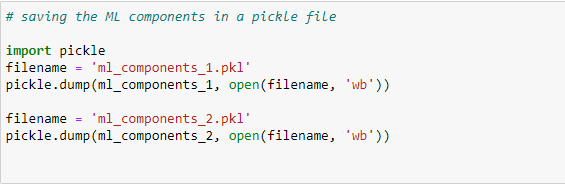
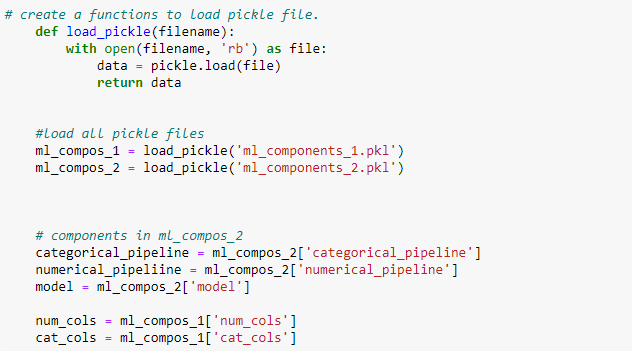
The model that will be used in this application is a regression model that uses 11 features to make a prediction. The machine learning components were divided into two: the ml_component_1 consists of the list of values in the various columns while the ml_component_2 consists of the numerical pipeline, categorical pipeline, and the model (decision tree regressor). The model along with its associated components was saved as a pickle file which will be imported to build the application.
Saving ML components using pickle
Application Building Process
The following are the processes we will be going through to build an application for the machine learning model.
· Setting up an environment to make sure our application is stable, reproducible, isolated, and consistent, and that it will work as intended.
· Building the interface
· Importing the machine learning components into the workspace.
· Setting up the backend to process inputs and display outputs
· Deploying the application
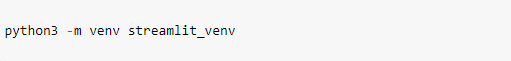
Setting up Environment
A Python environment is a collection of resources, tools, and configurations that allow you to work with Python and its libraries. The essence of a Python environment is to provide a consistent and reproducible set of conditions for your Python code to run in, regardless of the underlying hardware or software on which it is executed.
Creating the environment
The environment that will be created for building the Streamlit app is the Streamlit_venv environment created using the venv module in Python.
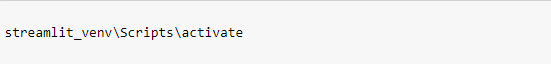
Activating the environment
Installing dependencies and requirements
After the environment has been set and activated, the application’s requirements and dependencies are installed to ensure that the model has the same dependencies and requirements used during its training.
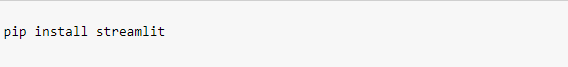
Begin by installing Streamlit using pip
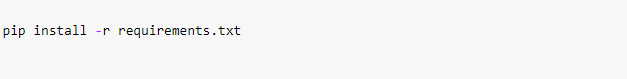
Then install the requirements and dependencies saved in the requirement txt file.
Creating the App Interface
Import Machine Learning (ML) Components
It was stated previously that two pickle files were created (ml_components 1&2). The ml_components_1 is a dictionary containing the values of the various features. Hence, it will be imported together with the ml_components_2 and the features of the component_1 will be used to build the interface of the app.
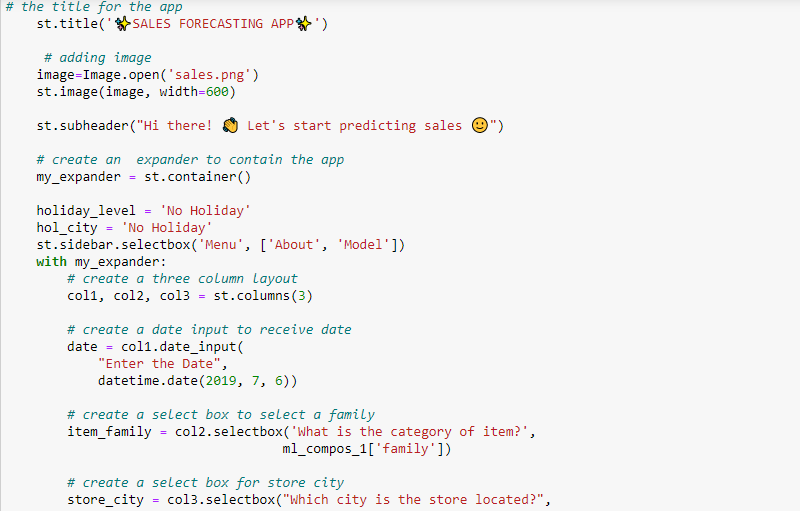
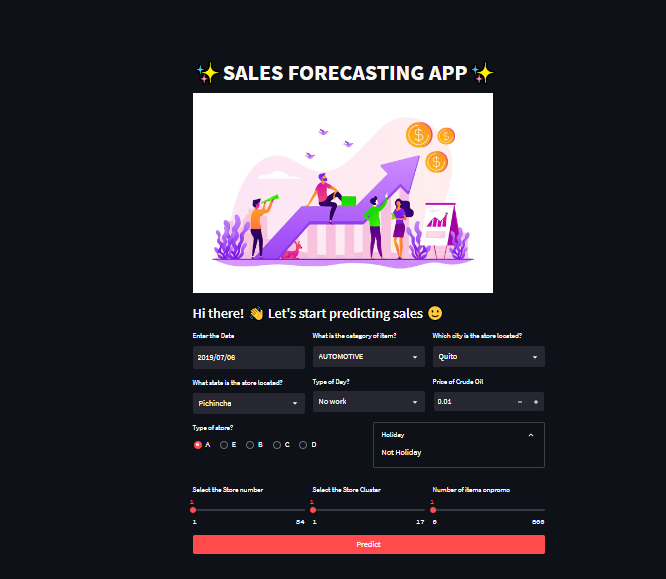
The interface of the application includes a date input, select boxes for item family, store city, day type, and store state, a number input for the crude oil price, a radio button for store type, and sliders for store number, store cluster, and the number of items on promo. It also includes a button for making predictions.
Streamlit’s column layout and expander features were used to create the application’s interface.
Setup the backend to process inputs and display outputs
Feature engineering
Functions were created which became new features in the application’s development. This was to ensure the model’s prediction during training will be the same in building the application in order to maintain consistency. The functions are: date_extracts and payday.
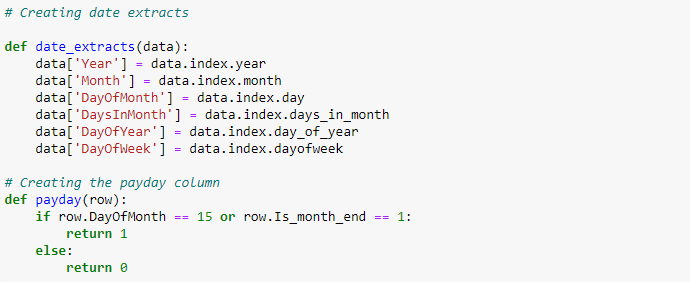
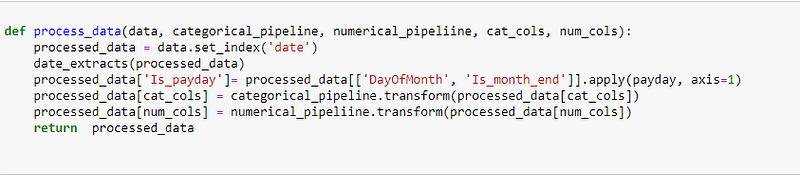
The function process_data takes in data, categorical and numerical pipelines, and categorical and numerical columns. It sets the index of the data to be the date column and extracts date features. It creates a new feature ‘Is_payday’ based on the values of ‘DayOfMonth’ and ‘Is_month_end’. It transforms categorical and numerical data using the respective pipelines and returns the processed data.
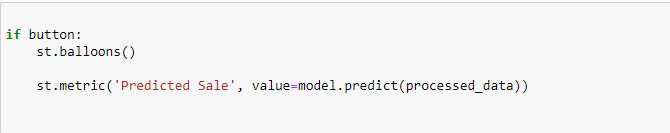
Making Predictions
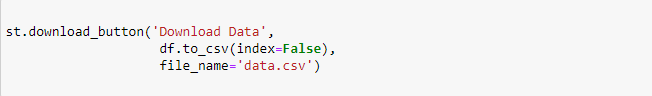
Adding Download Button
This component allows users to download their input history any time predictions are made.
Running the App Locally
The Streamlit app was executed locally by running the Streamlit run command followed by the name of the Python script containing the app definition which in this case is main.py.
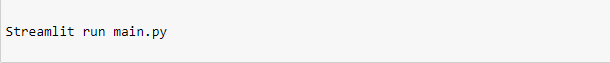
Image of the App’s Interface
Conclusion
This is a store sales application built with Streamlit to enable businesses to make predictions with a friendly user interface.
More details can be found in my ( GitHub). Thank you for reading and I would be glad to receive your suggestions and corrections.