
Stop The Bleeding: 4 Strategies To Troubleshoot, Triage Data Anomalies
Quickly identify, isolate and fix malfunctioning data pipelines for quality data, happier stakeholders and a stress-free workday.
I need your help. Take a minute to answer a 3-question survey to tell me how I can help you outside this blog. All responses receive a free gift.
The Usual Suspects Cause Anomalies In Your Data
Only in data science does a mistake make the company look better.
Spikes in user activity, millions more rows of mineable data and inflated revenue values.
On the surface, these all sound like good things. In more volatile fields like finance it’s rare but still plausible for an investment banker to approach a manager, say an investment’s returns increased by 5x overnight, and for the manager to not think anything of it.
If you say that to a data-minded executive, in their mind, your voice will fade and the only sound they’ll hear is alarm bells.
This kind of strange, out-of-nowhere variance in data has a name: Anomaly.
Companies with solid data infrastructure incorporate upstream and downstream checks for anomalies to ensure that the data that is delivered is clean, timely and, above all, accurate.
But such detection systems aren’t intelligent enough to just “know” how to spot an anomaly. These systems become more reliable as their underlying models are trained over time and on increasingly vast sources of data.
So if your model is unqualified for the job, who identifies, investigates and troubleshoots anomalies in newer data sources?
You.
For a newer data engineer, getting a message like “I don’t know what’s going on with this data” can be a bit intimidating, even if it’s something you partially or entirely built.
Luckily, as you gain experience investigating data anomalies, you start repeatedly encountering the same “usual suspects.”

Usual Suspect #1: A Broken Pipeline
The good news is a broken pipeline is simultaneously the easiest and hardest suspect to catch.
The tricky part is that when I say “broken” pipeline, I’m not referring to a script that triggers errors.
That’s a different beast.
Remember:
Execution != functionality.
In my mind if a pipeline isn’t reliably fulfilling its intended function, it’s broken.
If it’s a critical bit of infrastructure connected to other downstream processes then this becomes a big problem that infects every component of your data ecosystem.
A few red flags of a broken pipeline include:
- Multiple days of triggering a “no data” exception (you should always implement error handling for this reason)
- Unusual row counts (either too few or too many)
- Bad API requests that are logged but not addressed or trigger alerts
The following is code from a function I use to access my personal Stripe earnings.
Note the exception message. Additionally, notice how the message was repeated on multiple runs. Since this doesn’t run every day, that was an issue.
if len(current_dt_check) < 0:

        data = make_request(cfg.base_url, token)

        logging.info("Creating data frame...")

        df = format_df(data)

        if len(df) > 0:

            logging.info(f"Uploading to {cfg.dataset}.{cfg.table}")

            upload_to_bq(df, cfg.dataset, cfg.table, cfg.schema)

            logging.info(f"{cfg.dataset}.{cfg.table} updated with earnings from month: {cfg.current_month}")

        else:

            logging.info(f"No data available for month: {cfg.current_month}")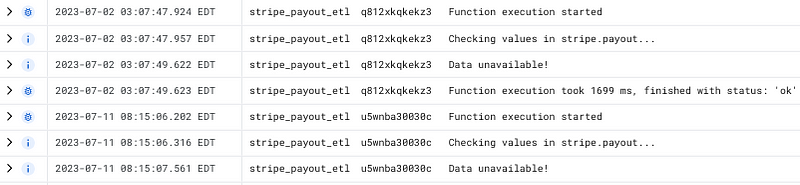
If your pipeline is exhibiting any of the above behaviors, you’ll want to pause any trigger/schedule it’s on, take the code out of production and, above all, communicate to stakeholders that data will be unavailable until you’re confident that the pipeline is functional.
Fixes will vary depending on the error source, but the best place to begin is to look at your API request and step through each part of the ETL, EL or ELT process until you find the culprit.
Pardon the shameless plug— To get access to my weekly writing, please feel free to become a Medium member using my referral link (I receive a small commission from each individual who joins).
Usual Suspect #2: Downstream Letdowns
Data doesn’t live in isolation or even just in your data warehouse.
Data, like any resource, is made to be consumed, or, more accurately, devoured.
This is why, if you don’t have a robust alerting infrastructure, often stakeholders will be the first individuals to alert you to anomalous data.
Because they can literally see the problem.

Depending on how your organization or future organization’s data teams are structured, dashboard design might be the domain of analytics engineers or data analysts.
But if that dashboard relies on a source table or view, guess who they’ll be approaching first?
In this scenario we’ll assume that your upstream processes are functioning correctly, or at least as expected.
This is when you need to examine specific components of the loader scripts and views that power the dashboards.
You might check for:
- A malfunctioning join
- A dimension changing types
- Data “freshness” or availability
Having data connected to a dashboard can sometimes make it easier to “see” the problem.
Pardon the interruption: For more Python, SQL and cloud computing walkthroughs, follow Pipeline: Your Data Engineering Resource.
To receive my latest writing, you can follow me as well.
Usual Suspect #3: Crossing a line–Timezones
If you’ve worked in programming, especially data-oriented programming, you’ll share my frustration with timezones.
To understand how truly complex the concept of separate time zones is, I suggest you watch this talk I attended from PyCon 23. The variance in time zones is staggering.
Since third-party data sources come from vendors around their world, they might timestamp their data with a different timezone than the one in which your organization operates.
This is less problematic in streaming processes, since data is ingested in real time.
But this can make daily batch jobs more complex because if your stakeholders want to look at daily numbers with a cutoff of midnight PST and your vendor provides data with an EST or UTC timestamp, then there’s a chance you could omit a whole cohort of numbers.
And if you thought stakeholders got upset over inflated numbers, I would argue deflated data looks far worse.
In this scenario, you’ll want to make sure your processes account for time zone changes. In both Python and SQL if you are making a comparison using a timestamp, make sure you specify your desired time zone. I’m biased toward EST because I live on the U.S. east coast.
SELECT CURRENT_DATETIME() AS utc, CURRENT_DATETIME("America/New_York") AS est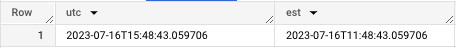
Note the +4 hr difference between EST and UTC. This could cause issues for a daily load job.
Once you’ve solved the timezone problem then you’ll need to adjust your processes to account for a whole different time beast–daylight savings.
Usual Suspect #4: Data Loading Over and Over and Over Again
Having gained a bit of experience with both functional and nonfunctional data systems, one of the first things I check for is duplicate data.
Being able to quickly identify and filter out duplicate data is a compelling reason to add a timestamp each time your process loads.
I once encountered an issue with inflated revenue values in less than 2 hours because I could clearly see that the exact same data had loaded multiple times.
Here’s a replication of that scenario using personal data.
Notice how rows updated 4 times on 6/29.
SELECT DISTINCT updated_time FROM my_log
WHERE DATE(updated_time) = "2023-06-29"
ORDER BY updated_time DESC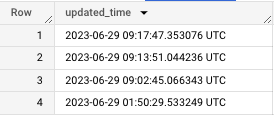
Deduplication doesn’t just stop at removing duplicates.
You also need to make the necessary adjustments to ensure that the duplicates don’t recur.
Since I’ve written about deduplication, I’ll leave you with a two-step strategy for prevention:
- Check for new data
- On each run, delete today’s data before loading
The second step ensures that even if you’re loading multiple times, you’re also “refreshing” the data so you only get the most recent data per day.
Like many aspects of life, troubleshooting is something you learn as you do.
By its nature, data science education focuses much more on building than it does anomaly detection or rebuilding.
Depending on the organization your senior engineers might do the bulk of the identifying and fixing of problems.
But when it’s your turn to stop the bleeding, stay calm, be thorough and go round up the usual suspects.
Create a job-worthy data portfolio. Learn how with my free project guide.


