
Silver and Gold Reunite After Their Historical 2020 Breakup, But …
Could silver run away with inflation in 2021?
Silver holds a special place in my heart because it was the first investment I ever made. Back then one could walk into a brokerage house and open an account with a driver’s license and $25 cash. I placed an order for “paper” silver, which was about $5 per ounce at the time, and the equivalent of five 1-ounce silver coins rolled into my account.
Over the years I bought more silver, but it seemed the Hunt brothers’ attempt to corner the silver market in 1980 had taken the life out of the metal. Digital cameras arrived, reducing industrial demand for silver, and silver looked doomed. Even the geopolitical events from the late 1980s to the early 2000s couldn’t budge it above the price I bought it for. All I could do was patiently wait and comfort myself with the thought that this is long-term investing at its finest!
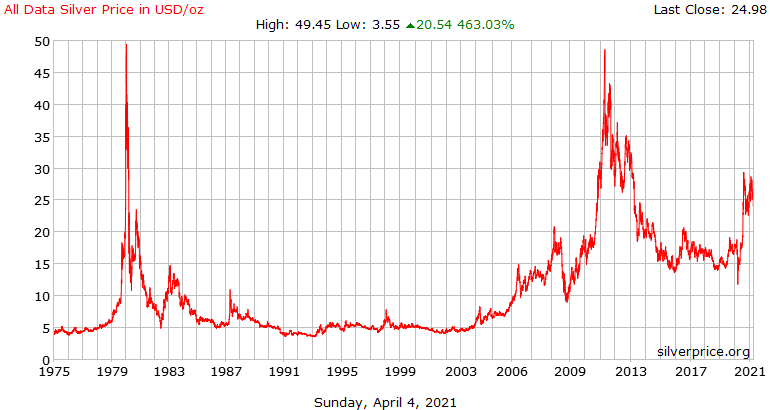
Investors like myself had to wait until, ironically, the silver anniversary of the Hunt brothers’ folly before silver started to rise again. The growing demand for silver and the 2007–2008 financial crisis first pushed the price to $20 per ounce. Then, after a brief retreat in late 2008, silver climbed to nearly $50 per ounce by 2011, driven by continued demand, global instability (Arab Spring, Fukushima nuclear disaster), and inflation from the effects of quantitative easing following the crisis. On the day silver peaked in April 2011, 1 ounce of gold would’ve cost you only 32 ounces of silver (this will be significant later).
The growing demand for silver in electronics and photovoltaic cells continued to affirm its value as an industrial metal and not just a luxury item (in jewelry and coins). The Silver Institute’s most recent 2020 World Silver Survey indicates 50% of the silver supply in 2020 was consumed by industry, of which 1/5, or 10% of the total supply, alone was for manufacturing photovoltaic cells. Since 2011, the growing photovoltaic demand for silver has offset declining silver demand by photography. Something about the “photo” process apparently attracts silver’s presence.
This brings us to one year ago on March 18, 2020, when the gold/silver price ratio hit an all-time high. Never in the history of tracking silver and gold prices had up to 124 silver ounces been required to purchase 1 ounce of gold. By comparison, the previous greatest “fallout” between gold and silver had been in 1991 when the ratio hit 100, and since then it had generally remained below 80. The below chart shows the gold/silver ratio since 1975 and illustrates how extreme the March 18 ratio was.
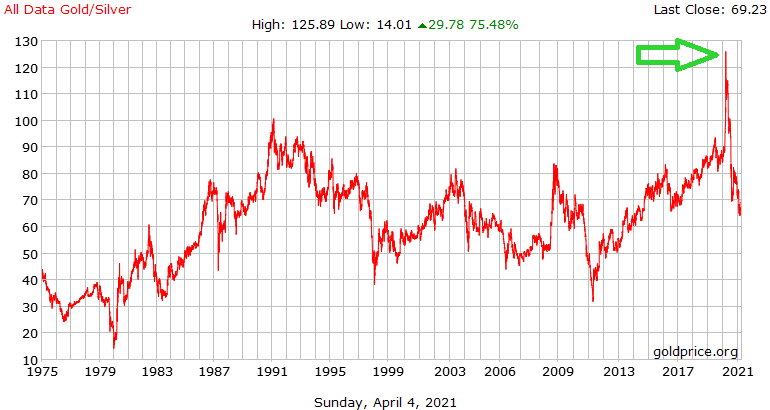
I recall seeing the news that day and was amazed by the history being made. Silver had gone into uncharted “undervaluation” territory with respect to gold and that meant only one thing. “Those two will eventually get back together,” I figured. If the ratio were a more normal 70, then silver should be over $20 per ounce, or $10 higher than where it was. And any silver mining stocks should take off as the price of silver recovers to a more normal level relative to gold.
Knowing the historical behavior of silver after such extremes in the gold/silver ratio can provide insights into future potential investment opportunities when similar extremes are repeated.
The stock market also experienced extreme price fluctuations during this time. The New York Stock Exchange recorded 2000 new 52-week lows on March 18, representing 70% of the stocks listed on the Exchange. People were pulling their money out of the market and it was crashing, but that money wasn’t being used to prop up safer havens like precious metals. Strange, I thought.
When the price of silver bottomed out at just under $12 per ounce on March 18, it had not been that low since early 2009 (the last major global crisis). However, “poor man’s gold,” as silver has been referred to, did not remain on sale for long. In the next five business days, its price rebounded a whopping 20%(!), to nearly $14.50 per ounce, and the gold/silver ratio fell to 112. Silver continued to move quickly and take big steps to reconcile its differences with gold. Five months later, when the price of silver closed above $29 per ounce for the first time in 8 years, the gold/silver ratio was a more normal 70.
So why is this important?
First, a “tension” appears to exist between silver and gold, with silver being the more volatile of the two. When silver becomes too over-or undervalued relative to gold, it gets pulled back into alignment (50–70 ratio range). In April 2011, when the gold/silver ratio closed under 32, it was pulled back to 44 in a month. Knowing the historical behavior of silver after such extremes in the gold/silver ratio can provide insights into future potential investment opportunities when similar extremes are repeated.
Second, the slingshot effect resulting from the release of gold/silver tension can cause other silver-related assets like mining stocks to catapult in price. Between March and August 2020, while the silver price increased nearly 2.5 times, some silver mining stock prices (for example, Hecla Mining — HL, Coeur Mining — CDE, and Great Panther Mining — GPL) increased 4 times. The relationship between silver price and silver mining stock price is comparable to that of the up and down movement on a seesaw — silver sitting closer to the middle and silver mining stocks out at the ends.
So what can be expected from silver in 2021 and beyond now that it has “reconciled” its differences with gold?
Increased Demand
Traditionally, precious metals have been purchased as a hedge against inflation. With multiple rounds of government economic stimulus in the last year, one would expect inflation to increase. According to some analysts, “an increase in the money supply doesn’t show up in general pricing for 1 to 2 years.” This provides a possible timeframe for inflation in consumer prices, stock market prices, or both.
One thing is certain — demand for gold and silver coins has been surging since last year. This raises the question— why?
Lower Gold/Silver Ratio
The implications of higher inflation on the price of silver don’t stop there. Historically, the gold/silver ratio has been generally lower when inflation has been higher or has spiked. This is due to silver’s greater volatility.
As inflation increases and silver outperforms gold, the gold/silver ratio can be expected to drop from its current 70. A ratio of 50 has been reached several times in the last 20 years, coinciding with generally higher inflation, and is therefore not unreasonable. A ratio of 32, like in April 2011 when silver peaked at nearly $50 per ounce, also can’t be excluded. It was reached following the previous crisis when the first economic stimulus (albeit smaller than the current stimulus) was used to revive the economy.
Lastly, the historically lowest ratio (15 in 1980) occurred when inflation was at its highest level in the last 40 years, combined with a small group of investors trying to corner the silver market. Whether those unique conditions can be repeated in modern times remains to be seen.
Higher Silver price
If inflation is expected to increase in the next 1 to 2 years, and the gold/silver ratio is expected to drop as precious metal prices rise, what price could silver reach? Looking at inflation-adjusted gold prices from 1980 and 2011, when the gold/silver ratios bottomed out (15 and 32), they are both remarkably similar — about $2200 per ounce in today’s dollars. Assuming this is a reasonable target price for gold in the aftermath of a major crisis with economic stimulus, applying gold/silver ratios of 50 and 32 yields a silver price range of roughly $45–70 per ounce (compared to $25 per ounce today). This represents a potential 100% return on silver, and greater potential returns on silver mining stocks, over the next two years.
Regardless of how silver performs in the coming years, the world’s financial system will continue to undergo significant change. The US Dollar is no longer backed by gold reserves. People are losing faith in conventional currency, given how easily it can be created and distributed for stimulating the economy. Cryptocurrency is becoming a new store of value, like gold. Silver is finding new industrial applications, including renewable energy. Has the time finally arrived for “poor man’s gold” to shine again?
Author’s disclaimer: This article is for informational purposes only. It is not intended to be used as financial advice. Please consult with your financial advisor before making any investments.


