
Sentiment Analysis of Stock Market in Python (Part 2)- Estimating Sentiment Scores with NLTK

This article is the second part of my earlier article about sentiment analysis of the stock market in Python. If you haven’t gone through the first part of my article, you are welcome to visit the previous article to gain the overall picture of the topic:
Sentiment Analysis of Stock Market in Python (Part 1)- Web Scraping Financial News
In this Part 2 article, we are going to proceed with the pre-processed news data from Part 1 and use the Python NLTK package to calculate the sentiment score.
Disclaimer: The writing of this article is only aimed at demonstrating the steps to perform stock market sentiment analysis in Python. It doesn’t serve any purpose of promoting any stock or giving any specific investment advice.
Github
The original full source codes presented in this article are available on my Github Repo. Feel free to download it (SentimentAnalysis_part2.py) if you wish to use it to follow my article.
Estimating Sentiment Score with NLTK
From Part 1, we have already acquired news data from Financial Modeling Prep (FMP), process it and store it in a dataframe.
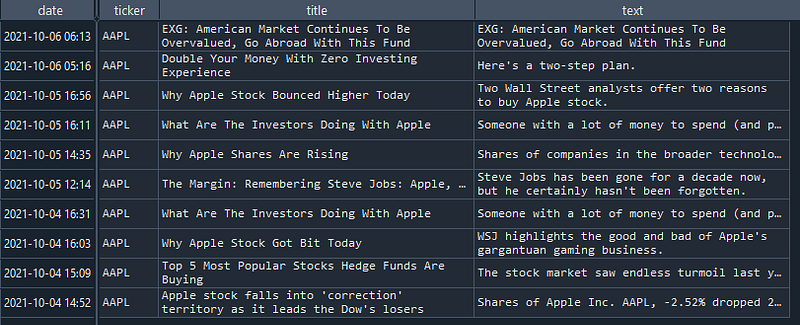
Now we are going to use VADER Sentiment Analyzer from the Python NLTK package to estimate the sentiment score of that news. VADER analyzes a text and generates a sentiment score by checking the existence of positive, negative and neutral terms in the text.
1. Get Started with VADER
To ease our understanding, let us try to use VADER to estimate the sentiment score just for one news.
Line 1–27: Previous scripts to web scrape financial news data and store them in a dataframe. (You may refer to my Part 1 article for further details)
Line 29: Create a VADER sentiment analyzer.
Line 30: Display the fifth news text (accessed by index-4).
Line 31: Use the VADER analyzer’s polarity_scores method to estimate the sentiment scores for the fifth news text and display the scores.

The sentiment scores are split into four parts:
- neg — Negative score
- neu — Neural score
- pos — Positive score
- compound — Normalized, weighted composite score.
The compound score is our target sentiment score which is ranged from -1 to 1. We can set a threshold that if the compound score is above 0.05, the sentiment is overall positive. The higher the score, the better the sentiment. In opposite, if the compound score is lower than -0.05, the sentiment is negative. If the score is between -0.05 to 0.05, the sentiment is neutral (neither positive nor negative).
In the case above, we can see the sentiment score (or compound score) is prone to positive as it is bigger than 0.05. This can be due to the existence of some positive terms in the text such as “rebounding”.
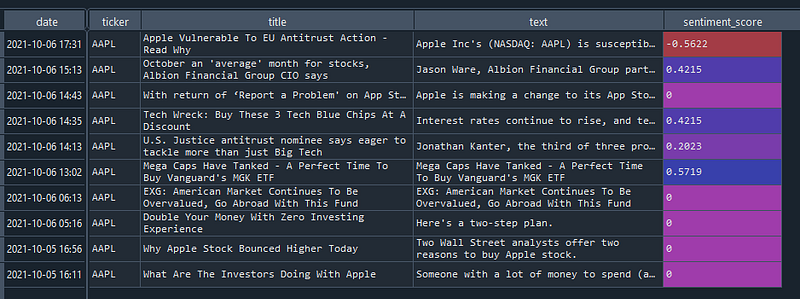
2. Applying VADER on All News Records
Now, we will use VADER to generate the sentiment scores for all our news records in the dataframe.
Line 1–2: Define a function, calc_sentiment_score, that will accept news text as input and use the VADER analyser’s polarity_scores method to compute the sentiment score and return it as an output.
Line 4: Create a new object of Sentiment Analyzer.
Line 5: Apply the calc_sentiment_score function on the news text column in the dataframe. This will invoke the function to sequentially work on the news text from the dataframe and generate sentiment score (compound score) for each of the news. The resulting list of sentiment scores is assigned to a new column of the dataframe, sentiment_score.
3. Visualizing Sentiment Scores on Graph
At last, we plot a bar chart of the sentiment scores to ease our interpretation and analysis of the result.
Line 1: Use the dataframe in-built plot method to create a bar chart for the sentiment scores.
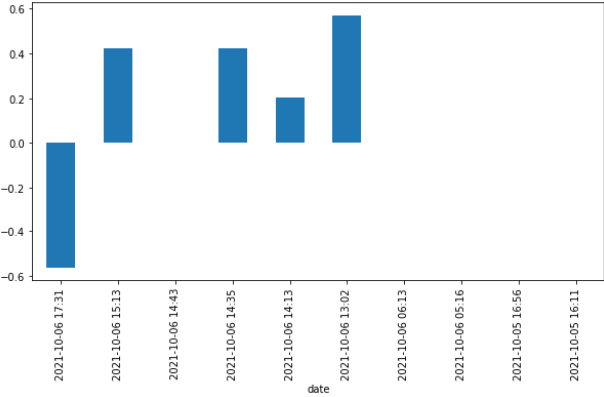
From the plot above, we can observe that the recent sentiments about AAPL are quite positive. The only negative sentiment is related to an antitrust issue in the EU. The rest of the sentiments are neutral.
However, this is important to note that we can’t solely depend on the sentiment scores to make our investment decision. Some common keywords in the finance context such as “bear” or “bull” might be treated as neutral terms by VADER Analyzer. Some seemingly positive keywords such as “rise” mustn’t be a good sign to either buy or sell an asset. In short, we will always need to verify the score with the news context.
Conclusions
We have managed to go through these two series of articles about the sentiment analysis of the stock market in Python. The sentiment analysis presented here is based on a lexicon-based approach which is to calculate orientation for a given text from the semantic orientation of words or phrases in the document.
While the resulting sentiment scores may not be completely reliable due to the potentially biased evaluation of some words’ usage, they still project a rough picture of the current market condition for an asset. This can be useful to help us plan for an investment at the right timing.
I hope you enjoy reading this article.
Subscribe to Medium
If you like my article and would like to read more similar articles from me or other authors, feel free to subscribe to Medium. Your subscription fee will partially go to me. This can be a great support for me to produce more articles that can benefit the community.