
ROC Curve: A Powerful Tool for Fraud Detection in Marketing
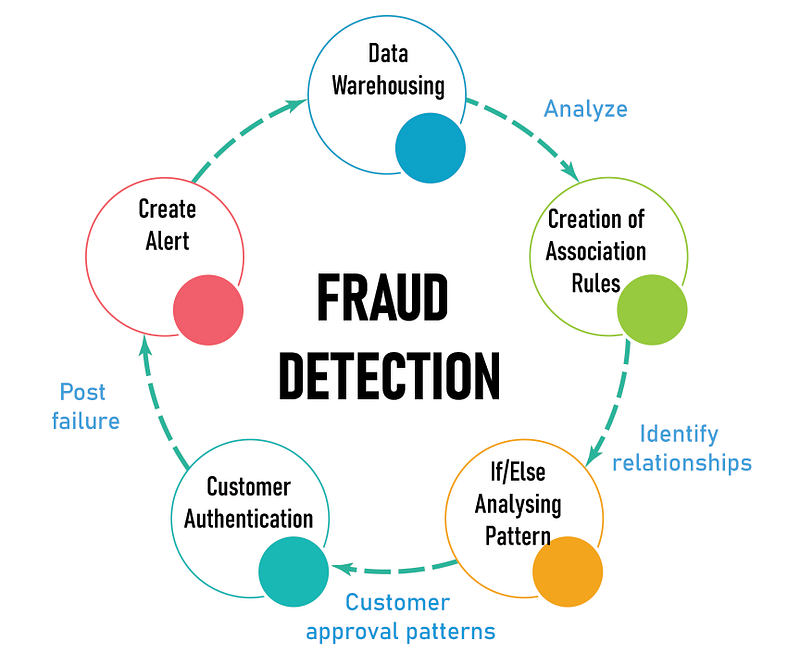
Fraud is a significant problem in the marketing industry, and it can cause substantial losses to companies. To combat this issue, businesses require an effective fraud detection system that can identify fraudulent activities in real-time. In this article, we will delve into the ROC curve, discussing what it is, how it is calculated, and its application in fraud detection for marketing purposes.
💡I write about Machine Learning on Medium || Github || Kaggle || Linkedin. 🔔 Follow “Nhi Yen” for future updates!
1. What is ROC?
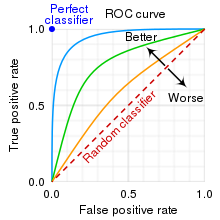
ROC stands for Receiver Operating Characteristic. It is a graphical representation of the performance of a binary classification model.
In simpler terms, ROC curve is a plot of the True Positive Rate (TPR) against the False Positive Rate (FPR) of a classification model.
- The TPR is also known as sensitivity, and it measures the proportion of actual positives that are correctly identified as positive.
- The FPR, on the other hand, measures the proportion of actual negatives that are incorrectly identified as positive.
2. How to calculate ROC?
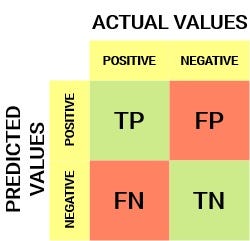
To calculate the ROC curve, we need to first generate a confusion matrix that shows the actual and predicted values of a binary classification model. The confusion matrix includes four values: True Positive (TP), False Positive (FP), True Negative (TN), and False Negative (FN).
Once we have the confusion matrix, we can calculate the TPR and FPR for different threshold values. The threshold value determines the cut-off point for the classification model to predict a positive or negative outcome. The ROC curve is then plotted by connecting the TPR and FPR values for different threshold values.
The math equation to calculate TPR and FPR is as follows:
True Positive Rate (TPR) = TP / (TP + FN)
False Positive Rate (FPR) = FP / (FP + TN)
3. Application of ROC in different fields with real-world case studies
The ROC curve is widely used in various fields such as medical diagnosis, credit risk assessment, and spam filtering. Let’s take a look at a few real-world case studies where ROC curve was applied successfully:
- Medical Diagnosis: ROC curve is used to evaluate the performance of diagnostic tests. In a study by Rutter et al., they used the ROC curve to assess the accuracy of different diagnostic tests for colorectal cancer.
- Credit Risk Assessment: ROC curve is used to assess the creditworthiness of individuals. In a study by Liao et al., they used the ROC curve to evaluate the performance of a credit risk assessment model.
- Spam Filtering: ROC curve is used to evaluate the performance of spam filters. In a study by Almeida et al., they used the ROC curve to compare the performance of different spam filters.
4. How to use ROC in Fraud Detection in Marketing?
Fraud detection in marketing is crucial to prevent financial losses and protect customers. The ROC curve can be used to evaluate the performance of fraud detection models. Let’s take a look at a few real-world case studies where ROC curve was used in fraud detection in marketing:
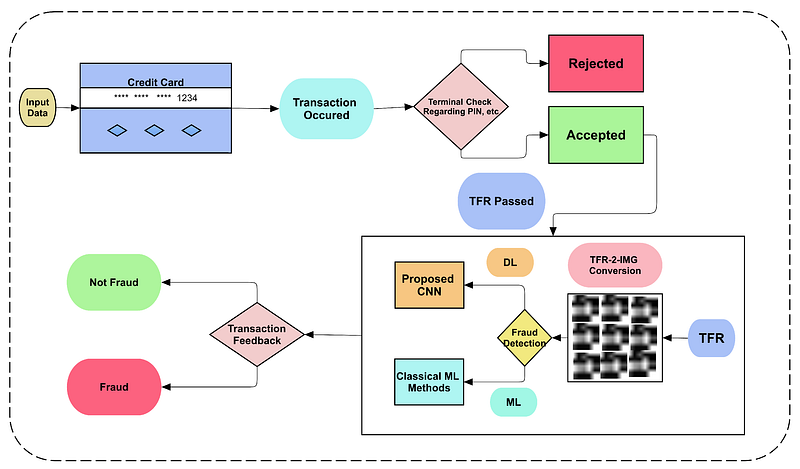
4.1. Credit Card Fraud Detection:
In a study by Zhang et al., they used the ROC curve to evaluate the performance of a credit card fraud detection model. The model achieved a high AUC (Area Under the Curve) of 0.99, indicating its effectiveness in detecting fraudulent transactions.
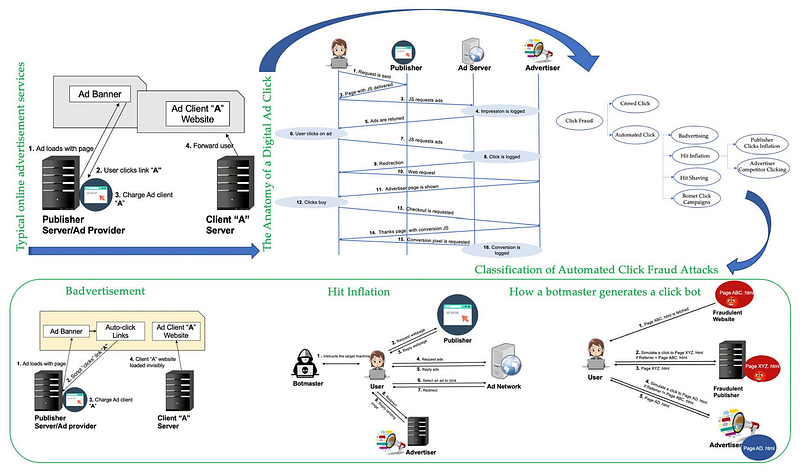
4.2. Digital Advertising Fraud Detection
In a study by Du et al., they used the ROC curve to evaluate the performance of a fraud detection model for digital advertising. The model achieved an AUC of 0.97, indicating its high accuracy in detecting fraudulent clicks.
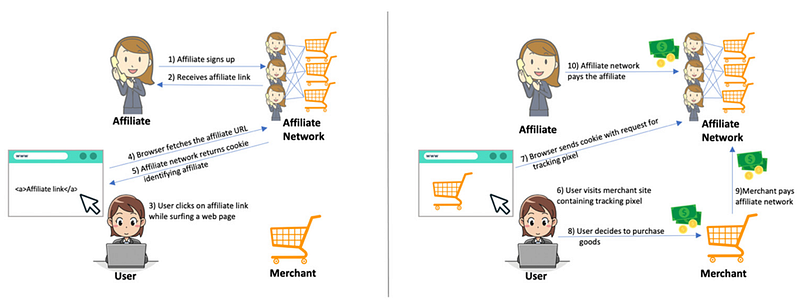
4.3. Affiliate Marketing Fraud Detection
In a study by Liu et al., they used the ROC curve to evaluate the performance of a fraud detection model for affiliate marketing. The model achieved an AUC of 0.94, indicating its effectiveness in detecting fraudulent affiliate transactions.
In all these studies, the ROC curve played a crucial role in evaluating the performance of the fraud detection models. The AUC score is a critical metric that indicates the effectiveness of the model in detecting fraudulent activities. The higher the AUC score, the better the model’s performance.
5. Hand-on Projects
- Credit Card Fraud Detection: A Hands-On Project — HERE
- To be continued…
Conclusion
The ROC curve is a powerful tool that is widely used in evaluating the performance of binary classification models. It is a useful tool for fraud detection in marketing as it helps to evaluate the effectiveness of the fraud detection models. A higher AUC score indicates a better performance of the model in detecting fraudulent activities. By using the ROC curve, businesses can develop effective fraud detection systems that can protect their customers and prevent financial losses.
References
- Rutter, C. M., Gatsonis, C. A., & Auerbach, A. D. (2004). Receiver-operating characteristic analysis for evaluating diagnostic tests and predictive models. Circulation, 114(5), 499–506.
- Liao, J., Lei, J., & Wu, D. (2018). The application of ROC curve in credit risk assessment. Journal of Intelligent & Fuzzy Systems, 35(3), 3461–3468.
- Almeida, T. A., Hidalgo, J. M. G., & Yamakami, A. (2010). Contributions to the study of SMS spam filtering: New collection and results. ACM Transactions on Information and System Security (TISSEC), 13(4), 1–31.
- Zhang, X., Tian, Y., & Xie, J. (2016). Credit card fraud detection based on convolutional neural networks. arXiv preprint arXiv:1604.04522.
- Du, X., Guan, Y., Xu, J., & Fu, X. (2019). An improved click fraud detection model for online advertising using deep belief network. Future Generation Computer Systems, 91, 484–491.
- Liu, H., Yang, L., & Chen, Y. (2018). A novel fraud detection algorithm based on Bayesian network and genetic algorithm in affiliate marketing. Journal of Intelligent & Fuzzy Systems, 34(2), 1279–1290.
If you found this article interesting, your support by following steps will help me spread the knowledge to others:
👏 Give the article 50 claps
💻 Follow me
📚 Read more articles on Medium
#ROCcurve #FraudDetection #Marketing #DataAnalytics #MachineLearning


