
Ranking a Multi Level Matrix in Power BI
Creating a multi-level matrix in Power BI can be a game-changer for data analysts and business intelligence professionals. This article, “Ranking a Multi Level Matrix in Power BI,” delves into the intricacies of using DAX functions to rank data across multiple dimensions.
Key Highlights:
1. Introduction to Multi-Level Matrices:
- Understand the concept and benefits of multi-level matrices.
- Learn how they can provide deeper insights by organizing data hierarchically.
2. Using the RANK Function:
- Purpose: The
RANKXfunction is used to rank items in a table based on a specified expression. - Syntax:
RANKX(<table>, <expression>, [<value>, <order>, <ties>) - Example: Rank sales performance by region and product category.
3. Applying RANK:
- Write DAX formulae using RANK to rank your data.
- Customize the ranking order and handle ties effectively.
4. Best Practices:
- Ensure data accuracy by validating your DAX expressions.
- Use conditional formatting to highlight top and bottom performers.
- Regularly update your data model to reflect the latest information.
By leveraging the power of RANK and other DAX functions, you can transform complex datasets into insightful, hierarchical visualizations.
Whether you’re looking to rank sales performance by region and product category or analyze customer feedback across different service levels, this guide provides the step-by-step instructions and best practices to make your data more actionable and visually compelling.
In effect you will end up with the below matrix:
Implementation in Power BI:
Here are all the steps we will be following in the step-by-step guide to help you set it up:
- Creating the DAX for CategoryRank
- Creating the DAX for SubCategoryRank
- Creating the DAX for CombinedRank
- Creating the matrix
Happy learning!

Step-by-Step Guide to create the matrix in Power BI
First of all understand this hierarchy :
Category → Sub Category
1. Creating the DAX for CategoryRank:
CategoryRank = RANKX(
ALLSELECTED(Table1[Category]),
CALCULATE(SUM(Table1[Sales]))
)
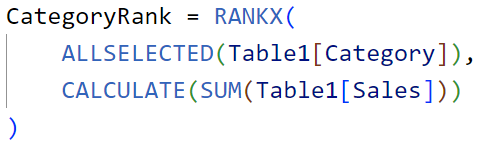
Explanation:
- RANKX Function: Ranks items in a table based on a specified expression, returning the rank of a number for each row.
- ALLSELECTED(Table1[Category]): Removes filters on the
Categorycolumn within the current context but keeps user-applied filters, considering all selected categories. - CALCULATE(SUM(Table1[Sales])): Changes the evaluation context to calculate the sum of
Salesfor each category, whichRANKXuses to determine the rank.
How It Works:
- Step 1:
ALLSELECTED(Table1[Category])creates a table of all selected categories. - Step 2: For each category,
CALCULATE(SUM(Table1[Sales]))computes the total sales. - Step 3:
RANKXthen ranks these total sales values, assigning a rank to each category based on its total sales.
2. Creating the DAX for SubCategoryRank:
SubCategoryRank = RANKX(
ALLSELECTED(Table1[Sub-Category]),
CALCULATE(SUM(Table1[Sales]))
)
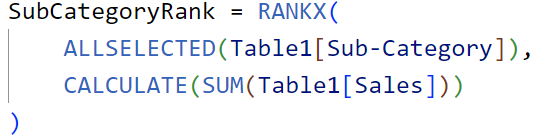
Explanation:
- ALLSELECTED(Table1[Sub-Category]):
- The
ALLSELECTEDfunction removes any filters applied to theSub-Categorycolumn within the current context but retains user-applied filters. This means it considers all the sub-categories currently selected in the visual or report context.
2. CALCULATE(SUM(Table1[Sales])):
- The
CALCULATEfunction changes the context in which the data is evaluated. Here, it calculates the sum ofSalesfor each sub-category. This sum is the expression thatRANKXuses to determine the rank.
How It Works:
- Step 1:
ALLSELECTED(Table1[Sub-Category])creates a table of all selected sub-categories. - Step 2: For each sub-category,
CALCULATE(SUM(Table1[Sales]))computes the total sales. - Step 3:
RANKXthen ranks these total sales values, assigning a rank to each sub-category based on its total sales.
3. Creating the DAX for CombinedRank:
CombinedRank = IF(
ISINSCOPE(Table1[Sub-Category]),
[SubCategoryRank],
[CategoryRank]
)
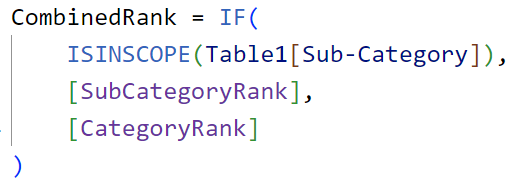
Explanation:
- IF Function:
- The
IFfunction checks a condition and returns one value if the condition is true and another value if it is false.
2. ISINSCOPE(Table1[Sub-Category]):
- The
ISINSCOPEfunction returnsTRUEif the specified column,Sub-Category, is in the current filter context. This means it checks if theSub-Categorycolumn is being used in the current visual or report context.
3. [SubCategoryRank]:
- If
ISINSCOPE(Table1[Sub-Category])isTRUE, the formula returns the value of[SubCategoryRank]. This means it uses the rank calculated for the sub-category level.
4. [CategoryRank]:
- If
ISINSCOPE(Table1[Sub-Category])isFALSE, the formula returns the value of[CategoryRank]. This means it uses the rank calculated for the category level.
So when the matrix is contracted i.e. only with category — Technology, Furniture and Office Supplies then ISINSCOPE is FALSE so only CategoryRank is displayed and when the matrix is expanded then ISINSCOPE is TRUE then SubCategoryRank is displayed.
4. Creating the matrix:
- Add Matrix from Visualizations.
- Add Category and Sub-Category in Rows section.
- Add Sales and CombinedRank in Values section.
- In Format visual → Visual → Layout and style presets → Style → Alternating rows.
Finally we have our matrix.
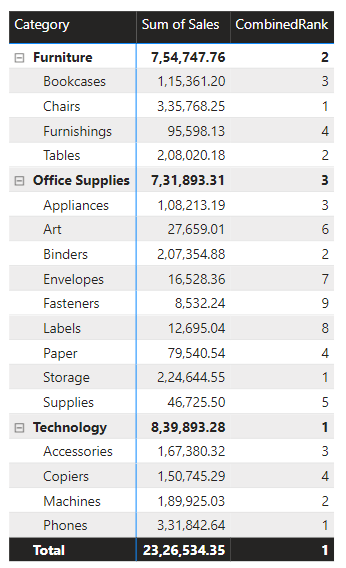
In level 1 the matrix is ranked by Category and in level 2 it is ranked by Sub-Category.
Thank you for your attention!
Follow me or subscribe to get all my Power BI articles!
Don’t forget to subscribe to
👉 Power BI Publication
👉 Power BI Newsletter
and join our Power BI community:


