
How to Produce a Zoomable Bifurcation Diagram in Tauri Using Rust
A brief guide to this fantastic functionality

Rust is probably one of the most future promising programming languages for scientific computations and machine learning. Both subjects require us to produce accurate computer experiments and simulations from time to time.
In one of my previous articles (see here), I already gave a small introduction on how to quickly set up a Desktop app based on Tauri that enables plotting data that come from calls to Rust functions.
This article is going to take this approach in order to produce a zoomable bifurcation diagram for the logistic map. For the theoretical aspects behind the matter, you give this article a read, but it is not required for this article.
Note, in the following several components and functions have the term feigenbaum in their name. This is not by chance and intends to contribute to the person who first started looking at this specific kind of diagram (see here).
The Tauri app itself has been created by using the vue-ts option in the npm create tauri-app. Moreover, the UI uses the component library PrimeVue and Sass as CSS extensions. Both can be integrated into the app like it is done for usual web apps.
All the code described here can be found in this repository. Feel free to clone it and play around. Note, when you cloned it, you must run the following command from within its root directory in order to fetch the client-side dependencies:
npm iOf course, this all assumes you have installed the requirements for developing with Tauri as listed here.
Implementing the Simulation
For this section, you will need some basic knowledge of Rust. In case you need a wrap-up, you may find an easy introduction here.
The bifurcation diagram is based on the following technique. For several values of r (bifurcation parameter) within a given interval [a, b], we choose a random start value x_0 and iterate the following dynamic system several times:
x_{n+1} = r * x_n * (1 - x_n)This gives a list of values that we call dark iterations. In a bifurcation diagram, we are interested how a system behaves in the long run. That is, we ask if it converges, for instance, to some periodic orbits or invariant sets. Therefore, we iterate the system once more m times, but now we store the list of values for plotting them later on.
In other words, if (v_1, v_2, ..., v_m) are these values, we plot for the specific r:
{(r, v_1), (r, v_2), ..., (r, v_m)}The part that is doing exactly the above-described simulation is this:
Note that this also allows you to operate on multiple initial points x_0.
We wrap the call to the above function with one that passes random initial points to it. Here’s what that looks like:
I am using the fantastic crate rand here to produce random values.
As I said, this has to be done for several values of r within an interval [a,b]. The following method is doing this and collects all the iteration outcomes as the return values. Here’s the code:
delta is the step with which we pick values in [a, b].
Finally, since all this may take considerably longer, it is wise to distribute this computation across available CPUs. We do this by splitting the interval [a,b] in as many pieces as cores are available (note, this makes use of the crate num_cpus). Here’s the code:
Synchronization between the spawned threads is achieved by Rust’s wonderful communication over channels.
In order to make all this accessibly from within the UI, we register the following Tauri command in main.rs:
Visualizing the Simulation
Although there are very strong plotting libraries like plotly in our scenario, it may be best to go with a plain HTML5 canvas element. This is very performant and can easily deal with a really large number of points.
The code that is doing the plot is located at Feigenbaum.vue. There is a canvas within the template that looks like the following:
<canvas ref="canvas" width="700" height="500"
      @mousemove="!state.simulating && handleMouseMove($event)"
      @mouseleave="state.hoveredR=undefined"
      @click="!state.simulating && handleCanvasClick()">
</canvas>
This canvas is referenced from the JavaScript code
const canvas = ref<HTMLCanvasElement | null>(null);and used to plot whenever new data arrive. The part that is requesting data and then plotting them is this:
invoke('plot_feigenbaum_diag', ...) is making Tauri invoke our same-named Rust function. The data will be stored in the variables x, y. So, x is a list with values for r and y the corresponding iterates. Essentially, these values are iterated (forEach) and then plotted into the canvas as a point (filled rectangle of width/height 1).
Though, before plotting these values to the canvas, we have to remember that the canvas uses different scaled coordinates and moreover, the y axis is mirrored. To deal with this, we first map all the (r, v)-pairs by transforming them into canvas coordinates. The method transfCoords is the following:
Building and Running the App
If you run the following command:
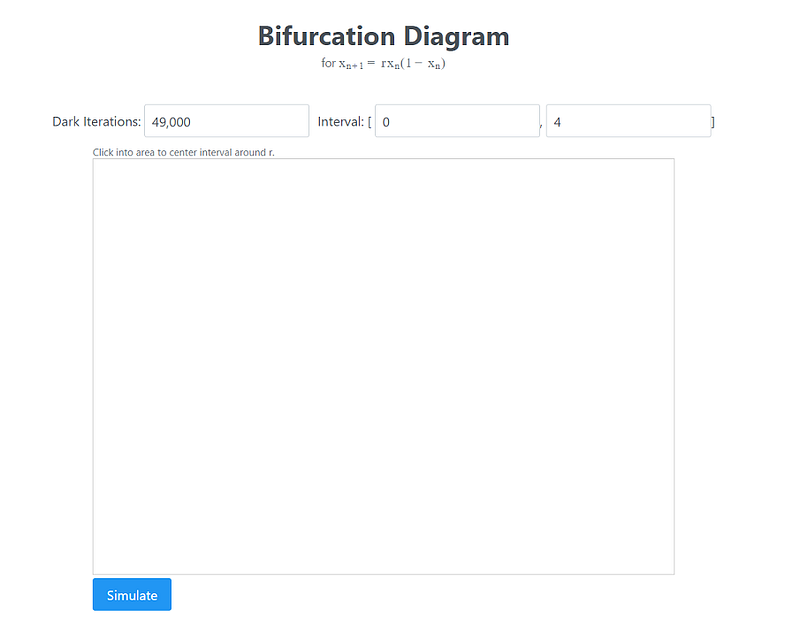
npm run tauri buildTauri will do all the build steps to produce a release version. Depending on your system, you will find an executable in the folder src-tauri/target/release. For me, it was the file feigenbaum.exe. After clicking it, the following UI appears:
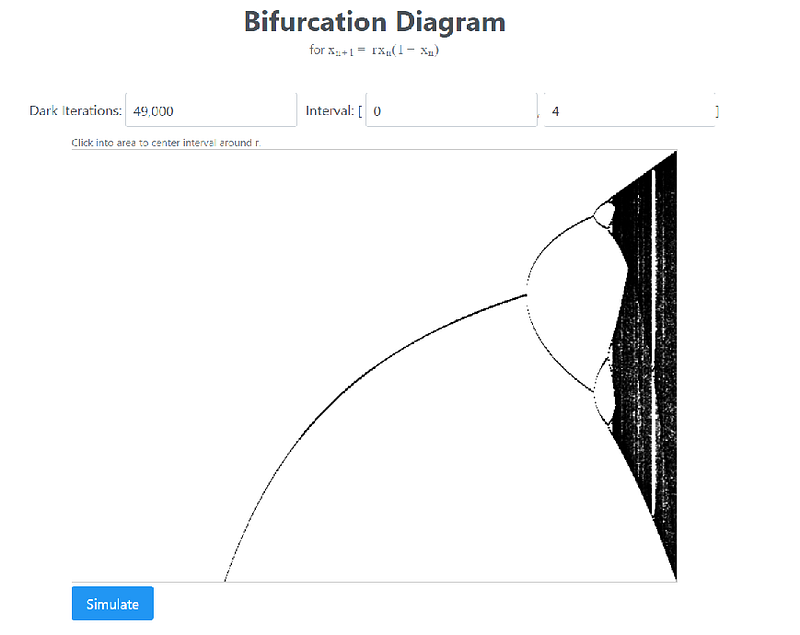
Pressing the simulate button produces:
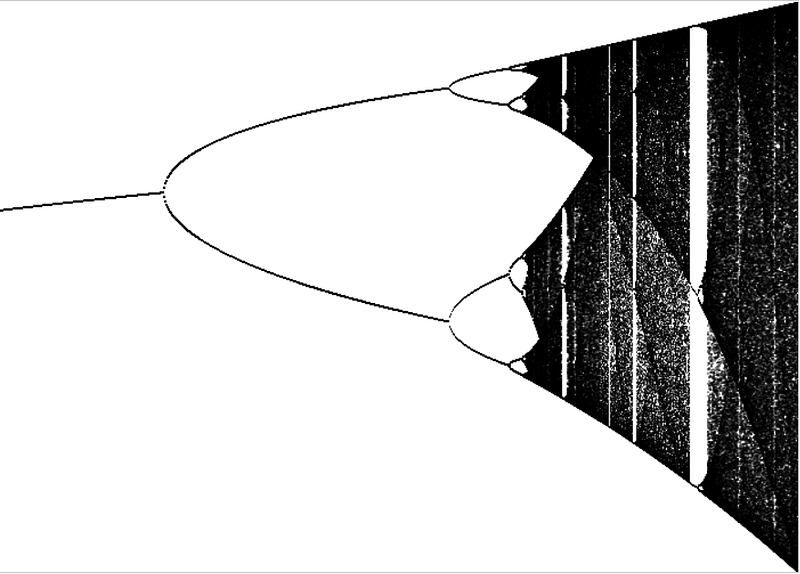
Moreover, if you click into the diagram, the interval will be adjusted to surround this point and to apply a zooming factor. So for instance, we can zoom the region of r = 3.74 to obtain the following diagram:
Now, you are free to experiment!
Thanks for reading!


