
Price Action with Single Candlesticks.
Continuing from “your starting guide on price action and Japanese candlesticks”, in this article we are going to start building our price action toolkit with our first single candlestick recognition and meaning.

Trend Bars versus Trading Range Bars
Al Brooks in his book “Reading Price Charts Bar by Bar” start by defining the two different types of Japanese candlesticks by saying that “every bar is either a trend bar or a trading range bar”.
The trend bars have a body that is at least half the size of the overall bar and it shows either a bullish or bearish tendency.
The trading range bars are closer to what it would be defined as doji, where the buyers and the sellers came to an almost equilibrium and thus the candlestick doesn’t show any direction tendency.
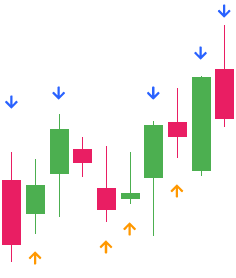
Since no candlestick is an island, other candlesticks on its left would provide context on the nature of the candlestick under research.
Al Brooks characterizes also the wicks of the candlestick as “failed breakouts”. The candlestick had the tendency to follow a direction but it failed and it failed behind.
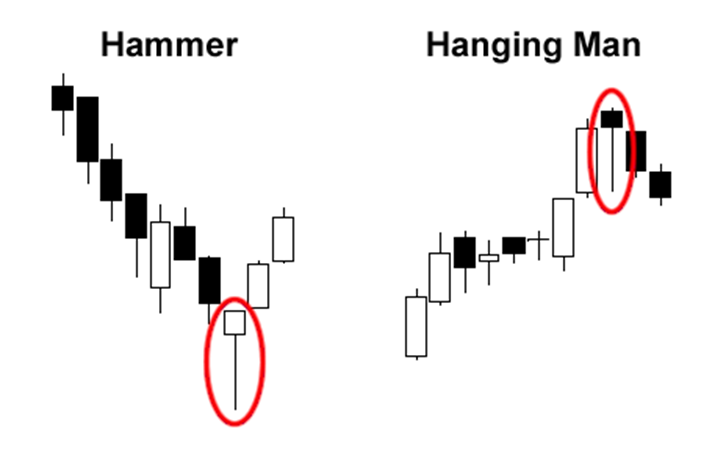
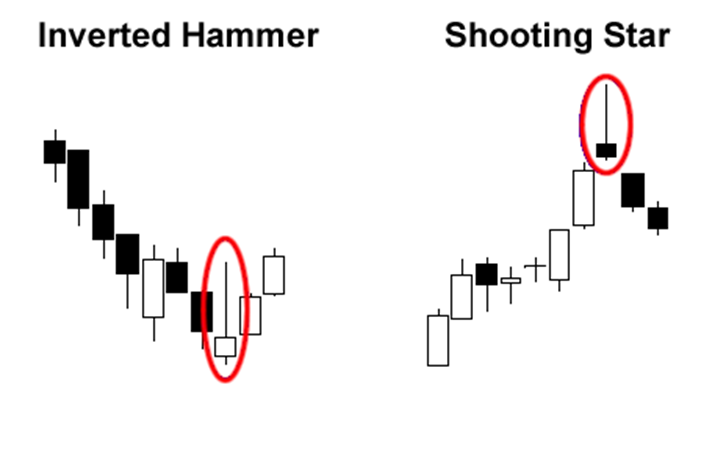
Hammer, Inverted Hammer, Shooting Star & Hanging Man
In that context, Hammer, Inverted Hammer, Shooting Star, and Hanging Man trading range candlestick formations are exactly that. All show a tendency to follow the existing trend but it was broken and a reversal of a trend followed.
The Hammer and the Inverted Hammer need to appear after a downtrend and the Hangind Man and Shooting Star after an uptrend. In both cases, when spotted, the stop loss might need to be placed a little further from the wick in which the trend has broken.
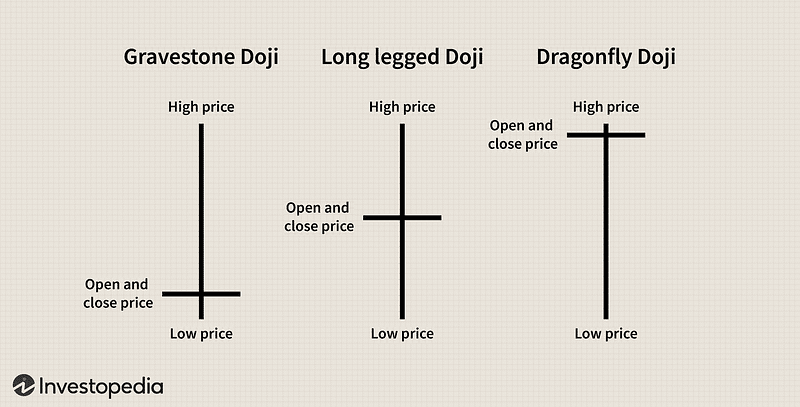
Gravestone Doji, Long-Legged Doji & Dragonfly Doji
The following trading range candlestick formations that fall into the doji category indicate also a trend reversal.
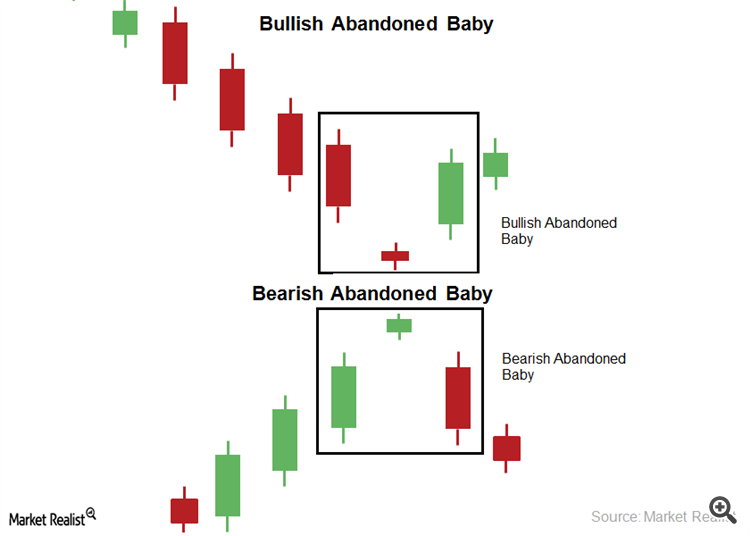
Bullish Abandoned Bady & Bearish Abandoned Bady
If on the above dojis we add a preceding gap then the formation after a bearish trend can be called Bullish Abandoned Bady, and after a bullish trend can similarly be called Bearish Abandoned Bady.
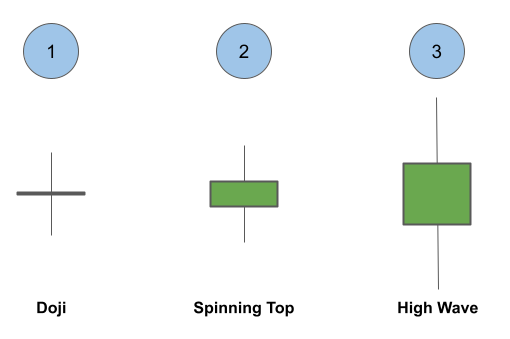
Spinning Top & High Wave
Doji’s with lengthier wicks have also different names. Following the same logic as the above formations, these dojis indicate possible trend reversal.
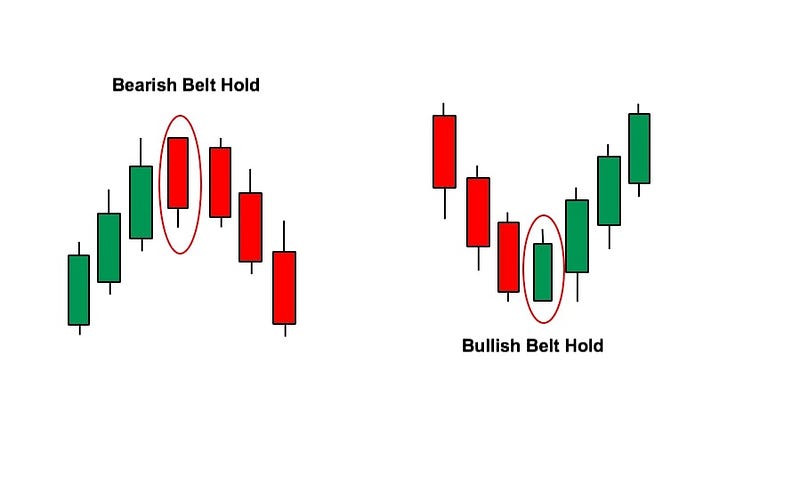
Bearish Belt Hold & Bullish Belt Hold
Trend bar formations that indicate trend reversal can be the Bearish Belt Hold and Bullish Belt Hold. The main identifier here is the gap from the previous candle’s close to the Belt Hold’s open.
Sources
- Encyclopedia of Candlesticks by Thomas N. Bulkowski
- Reading Price Charts Bar by Bar by Al Brooks