
What are the Prerequisites for Machine Learning?
Machine Learning is undoubtedly the most in-demand technology of the era! If you’re a beginner who’s getting started with Machine Learning, it’s important you know the prerequisites for Machine Learning. This blog will help you understand the different concepts that you need to know before you get started with Machine Learning.
Here’s a list of topics covered in this blog:
- Prerequisites for Machine Learning
- Understanding Machine Learning with a use case
Prerequisites For Machine Learning
To get started with Machine Learning you must be familiar with the following concepts:
- Statistics
- Linear Algebra
- Calculus
- Probability
- Programming Languages
Statistics
Statistics contain tools that can be used to get some outcome from the data. There is descriptive statistics which is used to transform raw data in some important information. Also, inferential statistics can be used to get important information from a sample of data instead of using complete dataset.
Linear Algebra
Linear algebra deals with vectors, matrices, and linear transformations. It is very important in machine learning as it can be used to transform and perform operations on the dataset.
Calculus
Calculus is an important field in mathematics and it plays an integral role in many machine learning algorithms. Data set having multiple features are used to build machine learning models as features are multiple multivariable calculi plays an important role to build a machine learning model. Integrations and Differentiations are a must.
Probability
Probability helps predict the likelihood of the occurrences, It helps us to reason the situation may or may not happen again. For machine learning, probability is a foundation.

Programming language
It is essential to know programming languages like R and Python in order to implement the whole Machine Learning process. Python and R both provide in-built libraries that make it very easy to implement Machine Learning algorithms.

Apart from having basic programming knowledge, it is also important that you know how to extract, process and analyze data. This is one of the most important skills that is needed for Machine Learning.
Machine Learning Use Case
Machine learning is all about creating an algorithm that can learn from data to make a prediction like what kinds of objects are there in the picture, or recommendation engine, the best combination of drugs to cure the certain disease or spam filtering.
Machine learning is built on mathematical prerequisites and if you know why maths is used in machine learning it will make it fun. You need to know the maths behind the functions you will be using and which model is suitable for the data and why.
So let’s start with an interesting problem of predicting house prices, having a dataset containing a history of different features and prices, for now, we will consider the area of the living space in square feet and the prices.
Now we have a data set containing two columns as shown below:
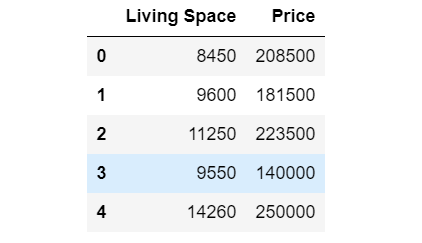
There must be some correlation between these two variables to find out we will need to build a model which can predict the price of houses, how can we do it?
Let’s graph this data and see how it looks like:
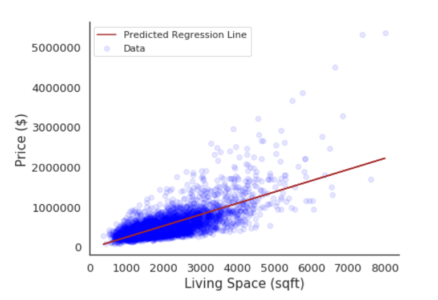
Here we are trying to create a line which is termed as:
Y=mX + c
This method of predicting the linear relationship between the target (dependent variable) and predictor variable (independent variable) is termed as linear regression. It allows us to study and summarize a relation between two variables.
- X = Independent variable
- Y = Dependent variable
- c = y-intercept
- m = Slop of line
If we consider the equation we have values for X which is an independent variable, so all we have to do is calculate values for m and c in order to predict the value of Y.
So how do we find these variables?
In order to find these variables, we can try a bunch of values and try to find out a line which intersects the maximum number of data points. But, how can we find the best fit line?
So in order to find the best-fit line, we can use least squares error function that will find the error between the real value of y and the predicted value y`.
The least-squares error function can be represented using the following equation:
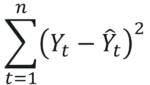
Using this function we can find out the error for each predicted data point by comparing it with the actual value of the data point. You then take the summation of all these errors and square them to find out the deviation in the prediction.
If we add the third axis to our graph containing all possible error values and plot it in 3-Dimensional space, it will look like this:
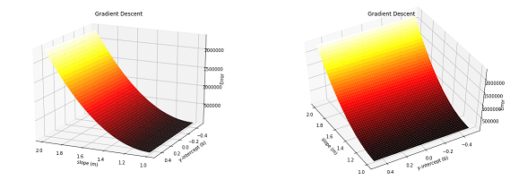
In the above image, the ideal values would be in the bottom black part which will predict the prices close to the actual data point. The next step is to find the best possible values for m and c. This can be done by using the optimization technique called gradient descent.
Gradient descent is an iterative method, where we start with initializing some set of values for our variables and improve them slowly by minimizing the error between the actual value and the predicted value.
Now if we think practically the prices of the apartment don’t really depend only on price per square feet, there are many factors such as the number of bedrooms, bathrooms, etc. If we consider those features as well then the equation will look something like this
Y = b0 + b1x1 + b2x2 + …..+bnxn + c
This is multilinear regression this belongs to linear algebra, here we can use matrices of size mxn where m are features and n are data points.
Let’s consider another situation where we can use probability to find the condition of the house in order to classify a house based on whether it is in good condition or bad condition. For this, to work we will have to use a technique called Logistic Regression which works on the probability of occurrences represented by a sigmoid function.
In this article, we covered the prerequisites of machine learning and how they are applied in machine learning. So basically, it consists of statistics, calculus, linear algebra, and probability theory. Calculus has techniques used for optimization, linear algebra has algorithms which can work on huge data sets, with probability we can predict the likelihood of occurrences and statistics helps us infer useful insights from the sample of data sets.
If you wish to check out more articles on the market’s most trending technologies like Python, DevOps, Ethical Hacking, then you can refer to Edureka’s official site.
Do look out for other articles in this series which will explain the various other aspects of Data Science.
17.R vs Python
18.Artificial Intelligence vs Machine Learning vs Deep Learning
21.Data Science And Machine Learning Tools For Non-Programmers
Originally published at https://www.edureka.co on August 6, 2019.


