
Multi-Class Metrics Made Simple, Part II: the F1-score
In Part I of Multi-Class Metrics Made Simple, I explained precision and recall, and how to calculate them for a multi-class classifier. In this post I’ll explain another popular performance measure, the F1-score, or rather F1-scores, as there are at least 3 variants. I’ll explain why F1-scores are used, and how to calculate them in a multi-class setting.
But first, a BIG FAT WARNING: F1-scores are widely used as a metric, but are often the wrong way to compare classifiers. You will often spot them in academic papers where researchers use a higher F1-score as “proof” that their model is better than a model with a lower score. However, a higher F1-score does not necessarily mean a better classifier. Use with care, and take F1 scores with a grain of salt! More on this later.
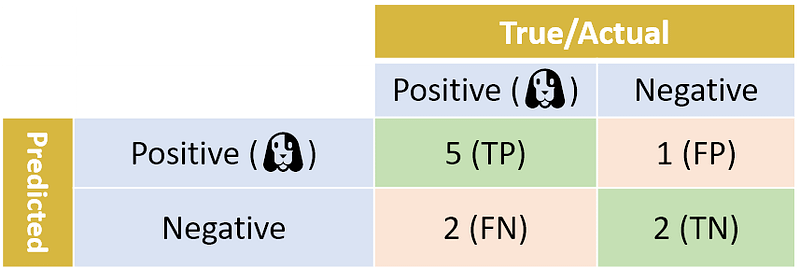
As in Part I, I will start with a simple binary classification setting. Just a reminder: here is the confusion matrix generated using our binary classifier for dog photos. The precision and recall scores we calculated in the previous part are 83.3% and 71.4% respectively.
In general, we prefer classifiers with higher precision and recall scores. However, there is a trade-off between precision and recall: when tuning a classifier, improving the precision score often results in lowering the recall score and vice versa — there is no free lunch.
Now imagine that you have two classifiers — classifier A and classifier B — each with its own precision and recall. One has a better recall score, the other has better precision. We would like to say something about their relative performance. In other words, we would like to summarize the models’ performance into a single metric. That’s where F1-score are used. It’s a way to combine precision and recall into a single number. F1-score is computed using a mean (“average”), but not the usual arithmetic mean. It uses the harmonic mean, which is given by this simple formula:
F1-score = 2 × (precision × recall)/(precision + recall)
In the example above, the F1-score of our binary classifier is:
F1-score = 2 × (83.3% × 71.4%) / (83.3% + 71.4%) = 76.9%
Similar to arithmetic mean, the F1-score will always be somewhere in between precision and recall. But it behaves differently: the F1-score gives a larger weight to lower numbers. For example, when Precision is 100% and Recall is 0%, the F1-score will be 0%, not 50%. Or for example, say that Classifier A has precision=recall=80%, and Classifier B has precision=60%, recall=100%. Arithmetically, the mean of the precision and recall is the same for both models. But when we use F1’s harmonic mean formula, the score for Classifier A will be 80%, and for Classifier B it will be only 75%. Model B’s low precision score pulled down its F1-score.
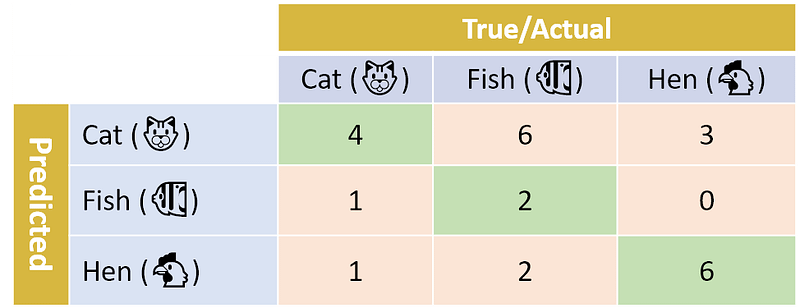
Now that we know how to compute F1-score for a binary classifier, let’s return to our multi-class example from Part I. A quick reminder: we have 3 classes (Cat, Fish, Hen) and the corresponding confusion matrix for our classifier:
We now want to compute the F1-score. How do we do that?
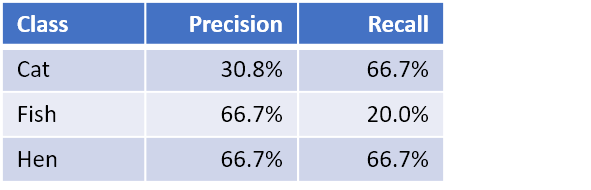
Remember that the F1-score is a function of precision and recall. And in Part I, we already learned how to compute the per-class precision and recall. Here is a summary of the precision and recall for our three classes:
With the above formula, we can now compute the per-class F1-score. For example, the F1-score for Cat is:
F1-score(Cat) = 2 × (30.8% × 66.7%) / (30.8% + 66.7%) = 42.1%
And similarly for Fish and Hen. We now have the complete per-class F1-scores:
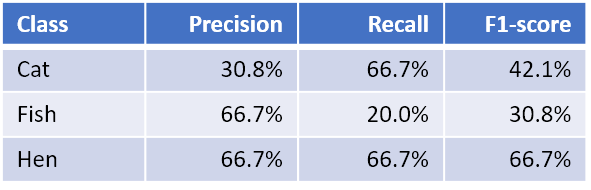
The next step is combining the per-class F1-scores into a single number, the classifier’s overall F1-score. There are a few ways of doing that. Let’s begin with the simplest one: an arithmetic mean of the per-class F1-scores. This is called the macro-averaged F1-score, or the macro-F1 for short, and is computed as a simple arithmetic mean of our per-class F1-scores:
Macro-F1 = (42.1% + 30.8% + 66.7%) / 3 = 46.5%
In a similar way, we can also compute the macro-averaged precision and the macro-averaged recall:
Macro-precision = (31% + 67% + 67%) / 3 = 54.7%
Macro-recall = (67% + 20% + 67%) / 3 = 51.1%
(August 20, 2019: I just found out that there’s more than one macro-F1 metric! The macro-F1 described above is the most commonly used, but see my post A Tale of Two Macro-F1’s)
When averaging the macro-F1, we gave equal weights to each class. We don’t have to do that: in weighted-average F1-score, or weighted-F1, we weight the F1-score of each class by the number of samples from that class. In our case, we have a total of 25 samples: 6 Cat, 10 Fish, and 9 Hen. The weighted-F1 score is thus computed as follows:
Weighted-F1 = (6 × 42.1% + 10 × 30.8% + 9 × 66.7%) / 25 = 46.4%
Similarly, we can compute weighted precision and weighted recall:
Weighted-precision=(6 × 30.8% + 10 × 66.7% + 9 × 66.7%)/25 = 58.1%
Weighted-recall = (6 × 66.7% + 10 × 20.0% + 9 × 66.7%) / 25 = 48.0%
The last variant is the micro-averaged F1-score, or the micro-F1. To calculate the micro-F1, we first compute micro-averaged precision and micro-averaged recall over all the samples , and then combine the two. How do we “micro-average”? We simply look at all the samples together. Remember that precision is the proportion of True Positives out of the Predicted Positives (TP/(TP+FP)). In the multi-class case, we consider all the correctly predicted samples to be True Positives. Let’s look again at our confusion matrix:
There were 4+2+6 samples that were correctly predicted (the green cells along the diagonal), for a total of TP=12. We now need to compute the number of False Positives. Since we are looking at all the classes together, each prediction error is a False Positive for the class that was predicted. For example, if a Cat sample was predicted Fish, that sample is a False Positive for Fish. The total number of False Positives is thus the total number of prediction errors, which we can find by summing all the non-diagonal cells (i.e., the pink cells). In our case, this is FP=6+3+1+0+1+2=13. Our precision is thus 12/(12+13)= 48.0%.
On to recall, which is the proportion of True Positives out of the actual Positives (TP/(TP+FN)). The TP is as before: 4+2+6=12. How do we compute the number of False Negatives? Taking our previous example, if a Cat sample was predicted Fish, that sample is a False Negative for Cat. More broadly, each prediction error (X is misclassified as Y) is a False Positive for Y, and a False Negative for X. Thus, the total number of False Negatives is again the total number of prediction errors (i.e., the pink cells), and so recall is the same as precision: 48.0%.
Since precision=recall in the micro-averaging case, they are also equal to their harmonic mean. In other words, in the micro-F1 case:
micro-F1 = micro-precision = micro-recall
Moreover, this is also the classifier’s overall accuracy: the proportion of correctly classified samples out of all the samples. To summarize, the following always holds true for the micro-F1 case:
micro-F1 = micro-precision = micro-recall = accuracy
I mentioned earlier that F1-scores should be used with care. Why? Although they are indeed convenient for a quick, high-level comparison, their main flaw is that they give equal weight to precision and recall. As the eminent statistician David Hand explained, “the relative importance assigned to precision and recall should be an aspect of the problem”. Classifying a sick person as healthy has a different cost from classifying a healthy person as sick, and this should be reflected in the way weights and costs are used to select the best classifier for the specific problem you are trying to solve. This is true for binary classifiers, and the problem is compounded when computing multi-class F1-scores such as macro-, weighted- or micro-F1 scores. In the multi-class case, different prediction errors have different implication. Predicting X as Y is likely to have a different cost than predicting Z as W, as so on. The standard F1-scores do not take any of the domain knowledge into account.
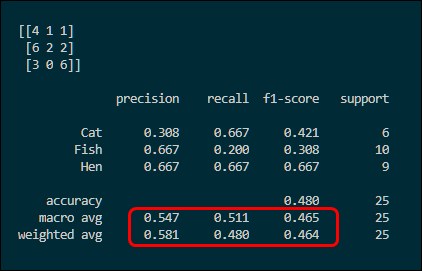
Finally, let’s look again at our script and Python’s sk-learn output.
Here again is the script’s output. The bottom two lines show the macro-averaged and weighted-averaged precision, recall, and F1-score. The accuracy (48.0%) is also computed, which is equal to the micro-F1 score.
This concludes my two-part short intro to multi-class metrics.
I hope that you have found these posts useful.


