
MLS Is Back Tournament Analysis
And evaluating the current meta going into the 2020 season

The MLS is Back Tournament was a one-off event during the 2020 MLS Season to mark the return to action after the league’s suspension due to COVID-19. The tournament brought 24 teams together in a bubble inside the ESPN Wide World of Sports Complex in Orland, Florida. Teams were put into 6 groups of 4 teams each, with the top 2 teams from each group and the four best 3rd places making it into a single-elimination bracket.
This report will take into account all 36 group stage games as well as the 15 bracket games, analyzing all of the shots, assists, goals, passes, duels, and many other metrics for every team to try to find trends among the top teams of the tournament. Moreover, the report will try to analyze team tactics and player behaviors that were prevalent during the tournament and might carry over to the remainder of the 2020 MLS season. Finally, we will use all of the data made available from the MLS to try to simulate what the remaining of the MLS might look like as things go back to normal.
Group Stage Analysis
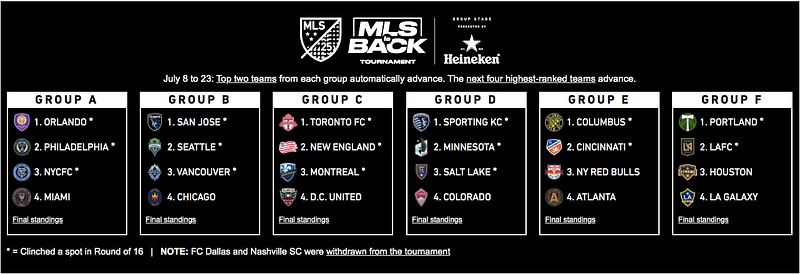
For the MLS is Back Group Stage, every team played 3 games with the hopes of making it to the elimination bracket. Columbus Crew was the only team to not only go undefeated in the group stage but also kept a clean sheet (no goals) in all 3 games.
Portland, Kansas City, Toronto FC, San Jose Earthquakes, and Orland City also qualified first in their respective groups. Group leaders averaged 6.8 points, with Toronto FC having the least points (5 points) and Columbus the most (9 points). They also averaged 2 wins, .16 losses, and .83 draws in this stage, with Toronto again having the least wins (1 win) and Kansas City being the only leader who lost a game in this stage. All leaders scored at least 6 goals in this stage and averaged 3.06 goals against. This goal difference among group leaders shows us that some of the best teams in the MLS seem to average a 1.96 or better scoring ratio.
LAFC, Cincinnati, Minnesota New England, Seattle, Philadelphia all qualified in 2nd place with NYFC, Vancouver, Montreal, and Salt Lake clinching the best 3rd places. These teams averaged 1.3 wins, .33 losses, and 1.17 draws. It seems that what made the difference between group leaders and their runner ups was the ability to secure wins by avoiding any draws. Moreover, these runner-ups averaged a 1.61 scoring ratio, and the best 3rd places averaged a .7526 scoring ratio.
Inter Miami, Chicago Fire, DC United, Colorado Rapids, NY Red Bulls, Atlanta United, Houston Dynamo, and the LA Galaxy all saw their tournament come to an end during the group stage. These teams averaged a .46 scoring ratio.
Something that immidiately stands out from team performance’s during the group stage is the relationship between team performance and scoring ratios. This metric seems to be a good indicator of how a team is performing when compared to other teams in the MLS, but will it be the deciding factor when the playoffs arrive?
Goals Breakdown
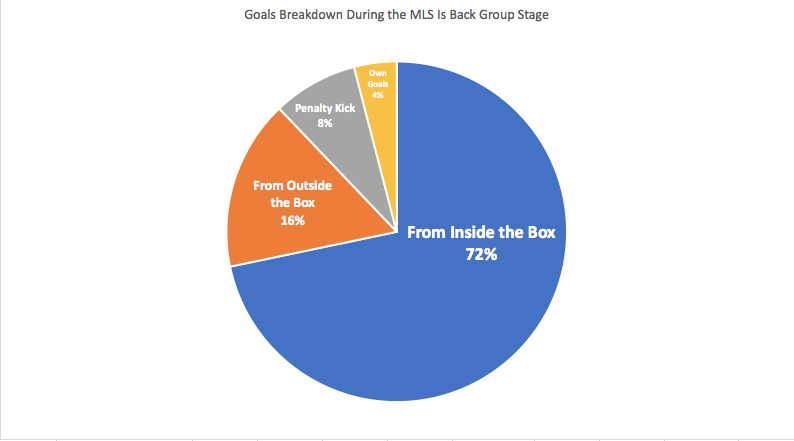
There were 99 goals scored during the group stage, with 71 of those coming from inside the box, 16 outside the box, 8 penalty kicks, and 4 own goals. Since 72% of the group stage goals came from within the box, let’s dive deeper into the kind of play from which the goal stemmed from.
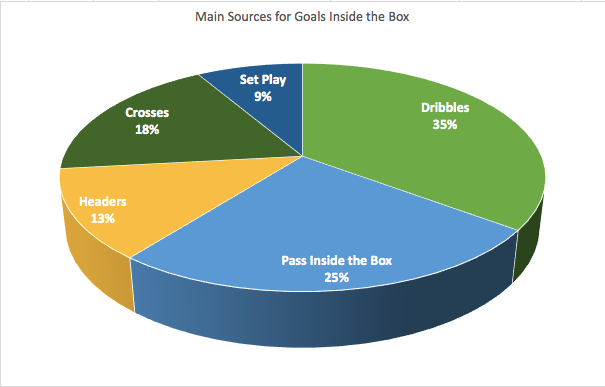
Out of the 71 goals from inside the box, 25 of them came from successful 1-on-1 dribbles from attackers coming through either side of the box and finishing, 18 came from a quick pass from inside the box, 13 came from crosses outside the box, 9 from corners, and 6 from set-pieces. We can observe that not only do the vast majority of goals come from inside the box, but most of the plays from which these goals come from also start inside the box by either succesful dribbles or a series of accurate passes.
From this information, we can observe a pattern that most accurately describes the attacking meta in the MLS. This means that teams who are the most likely to succeed are those teams who favor getting the ball to either side of the opposing team’s box over attacking through the middle of the field and taking shots from far away distances. These teams also have players who tend to take on defender’s 1-on-1 successfully through the wings and going inside the box instead of just sending crosses from the outside and can connect with attackers through successful short passes inside the box.
On the other side, the defensive meta in the MLS seems to demand fullbacks with more defensive traits like high percentages of duels won and interceptions rather than attacking tendencies like crossing success rate and assists. Moreover, since most goals stem from passes or crosses inside the box, defenders with a high percentage of interceptions per game, succesful aerial duels per game, and successful tackles per game seem to be the best options for teams to counter the current play-style in the MLS.
What is interesting is that out of the 25 goals that stemmed from 1-on-1 dribbles, 87% of the time those players were put into that position through 2–3 short passes from inside the box before they took on their duel, which further shows how important getting inside the opposing team’s box is in the MLS. Further in the report, we will analyze players who fit the current meta and might shine as the MLS unfolds.
MLS is Back Elimination Bracket
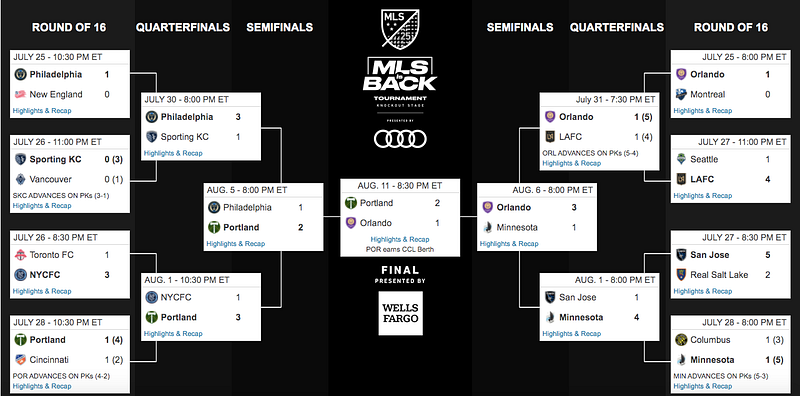
16 teams made it to the elimination bracket and a total of 15 games were played, with 4 of those games being defined in penalties. For the round of 16, 5 out of the 8 games were defined by a 1 goal difference with 3 of those settled through penalty series. What the round of 16 showed was that a team’s performance in the group stage would not automatically translate to the next round. Toronto FC and Columbus both lead their groups but lost in the first round. Similarly, Portland and Kansas had to go to penalties to win their games against lower-seeded teams.
During the final bracket, there were 44 goals scored. 19 of those came from 1-on-1 dribbles inside the box, and 8 from passes inside the box. While this is no different from the group stage, 15% of all goals in the playoffs came from a penalty kick (not counting series defined by penalty kicks).
Moreover, penalty kicks seemed to be the defining factors among the closest games during the elimination bracket. To put it into perspective, for the duration of the whole tournament, there was a penalty every 3.4 games and around 34% of all games were decided by a penalty kick (not counting penalty series).
While the elimination phase further confirmed both the attacking and defending metas in the MLS, it also introduced and highlighted the role penalty kicks play in the MLS. An average of a penalty kick every 3.4 games is far higher than most leagues in North America and Europe. What could explain such a high number of penalty kicks is that since most goals stem from either 1-on-1 dribbles or pass inside the box, there is a higher chance of teams committing a foul inside the box than in other leagues were the meta focuses more on long-passes and possession football. Moreover, some of the penalties called in the MLS would not be called in other leagues, meaning that referee behavior in the MLS also seems to trend to call more penalties than in other leagues.
Since these play, such a prevalent role in the MLS teams should implement attacking tactics that focus on moving the ball inside the opposing box as much as possible while defensively, teams should focus on avoiding contact inside the box and training goalkeepers in set pieces and penalty kick saves.

Game Evolution
One last thing that is worth noticing is not only from where the goals came from, but when they occurred. By analyzing the timing of the goals in the MLS Is Back Tournament, we can see how behaviors among MLS players seem to change as the game develops for those 90 minutes. This information can be used by coaches to make more informed decisions on when to make either attacking or defending substitutions at the most optimal point in the game to maximize a player’s efficiency.
The following is a breakdown of the 143 goals scored throughout the MLS is Back tournament and the period of the game in which they happened:
1st Half First 15 Minutes: 18 goals (12.5%) Second 15 Minutes block: 22 goals (15.43%) Last 15 Minutes: 21 goals (14.68%)
2nd Half First 15 Minutes: 18 goals (12.5%) Second 15 Minutes block: 23 goals (16.08%) Last 15 Minutes: 41 goals (28.6%)
The first observable trend I noticed is that there seems to be a relationship between goals scored and time. This means that as time increases in the game, the amount of goals also increases. The first 15 minutes of the average game is when the least goals are scored. This could be due to the fact that both teams have all their players rested, locker room tactics are still fresh in their minds, and they are still getting warmed up in the field. This is also true for the first 15 minutes of the 2nd half of a game since all players get a break and review tactics during half-time.
As teams seem to get warmed up and used to their opponent’s playing style, they tend to score more goals. There is an observable increase in the number of goals scored in the second block of 15 minutes in both halves. On average, the amount of goals scored after the first 15 minutes of a half seems to increase by 24.99%.
While the number of goals scored increases between 15 minutes blocks, there is little to no change in the number of goals scored during those 2 blocks in either half. There were 18 goals scored in the first 15 minutes of the first and second half, and 22 goals and 23 goals in the second 15 minutes of the first and second half respectively. However, it is in the last 15 minutes of each half were a material difference can be observed.
In the first half, there is only a 1 goal difference between the number of goals scored in the second 15 minutes block and the last 15 minutes of the half. This could be due to the fact that there are no new internal nor external variables injected into the game. It is unusual for any substitutions to be made in a game’s first half, meaning that all 22 players who started the game are still on the field. There is also some level of energy loss, but nothing that would change drastically the performance level of a top athlete. However, when it comes to the same 2 periods in the 2nd half, there was a 78.26% increase in the number of goals scored in the last 15 minutes of a game.
What could explain this increase? Well, it is the incorporation of new variables, both internal and external, that are injected into the game around that time. The current game score, players with either yellow or red cards, personal duels between a striker and a center-back, physical duels, player substitutions, referee bias, and many other variables are more prevalent and present during this period of time than in the first half of the game and they all dictate the way a game is played.
During the whole MLS is back tournament, the average time for the first substitution to be made was the 58.4 minute of the game, which happens to be at the beginning of the second 15-minute block of the half. If the same logic applies where we discussed it took teams 15 minutes to settle in and start scoring goals, this would mean that subbed players would take their first 15 minutes to settle in and get used to the current state of the game, and exploit all of the previously discussed variables in the last 15 minutes of a game. This would explain why there seems to be such a high increase in goals scored in the last 15 minutes of a game.
MLS 2020 Season Simulated
Now that we have analyzed all of the prevalent attacking and defending trends present in the MLS, we can use all of the data collected to run a quick simulation of how the MLS 2020 season might look like.
The process and statistical analysis that goes into this simulation was discussed in a previous article that I will have linked below, so there I will skip the whole explanation and dive into the full simulation.
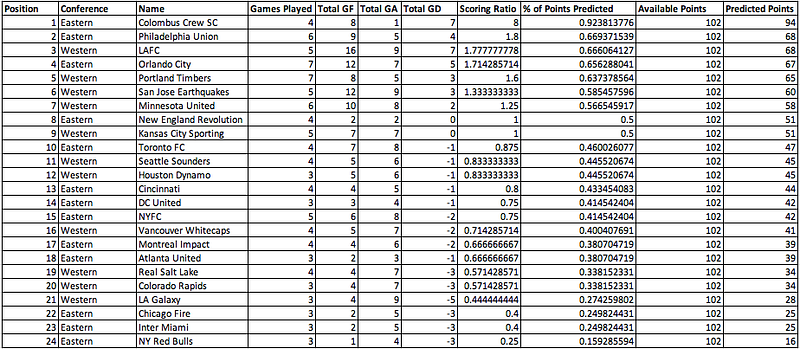
It is important to note many biases present in the simulation that will most definitely affect the results. For instance, some teams only played 3 goals while other teams played 6 or 7 games. Moreover, the MLS Is Back tournament took place in a bubble environment, taking away factors like travel fatigue and home court advantage that also play a role in a normal MLS season. Finally, teams like Nashville and Dallas that did not compete in the tournament would not be part of the simulation.
While the MLS Is Back tournament started as a one-off celebration of the return of soccer after COVID-19, the data gathered and the trends observed during throughout the tournament gave valuable insight into the prevalent behaviours among the top teams in the MLS and the current metas in the game.
Here is an article describing the whole process behind the simulation: