How I Predicted the Exact Outcome of 10 Premier League Games
And made $3,680 in the process

Is there a way to predict the outcome of any soccer game with 100% accuracy? The honest and simplest answer is…. no. Regardless of what your fantasy football friends say, there is absolutely no way to be 100% certain, but there is a proven, mathematical formula that gets really, really close! And it’s all thanks to baseball.
In the early 2000s, Bill James derived a formula that could calculate the percentage of games a baseball team “should” win by the end of the season. It was coined as the Pythagorean Win Expectation and is still used by sports analysts around the world. In order to avoid boring you with the math, all you need to know is that it uses the relationships between Runs Scored and Runs Allowed by a team to predict how many wins they should have by the end of a season.

However, baseball and soccer are 2 completely different sports. For instance, baseball is based on a 162 games season where performance is measured by wins and losses. On the other hand, soccer usually revolves around a 38 game season measured by a point system. So, how can this formula predict outcomes for soccer? Well, it can’t. At least not without tweaking it first.
There are thousands of academic papers online explaining all of the intricate math that goes into the process of deriving this formula and there is no way I could ever understand them. Therefore, for the sake of simplicity, we will take the following magic formula as face value:

Does this really work? Yeah, it does a pretty good job! Not only is the math pretty simple, but with some basic Excel knowledge, one is able to do this for all 20 teams in under 20 minutes! I used this myself to predict the outcomes of the last 10 games of the English Premier League and the results were extremely encouraging! Here is how I did it:
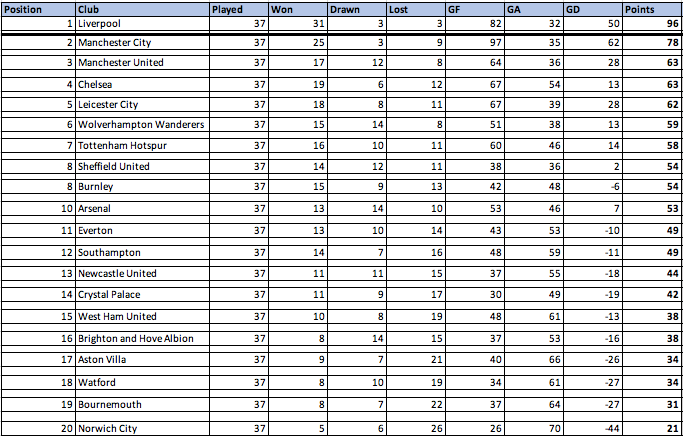
1- Get Your Data Ready Since we are going to try predict the outcome of week 38 of the Premier League, we need to gather all the relevant data up to week 37. That means Standings, Goals Scored, Goals Against, Wins, Losses, Draws, Points, etc. Thankfully, the Premier League has it all readily on their website for use. All we need to do is a simple Control+C and Control+V into our Excel sheet.
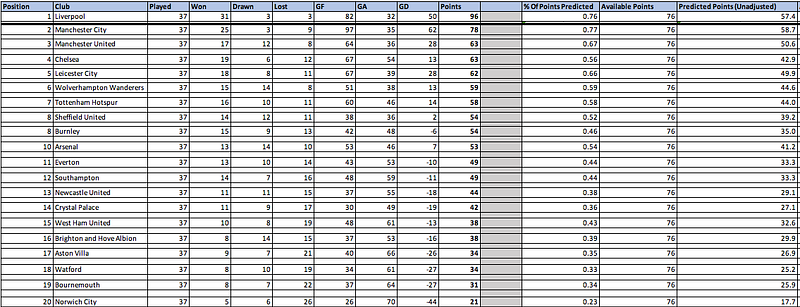
2.- Calculate the Percentage of Points Predicted per Team Here is where we get to use our magic formula! After you input it into excel on a separate column and apply, you will now have a percentage of points predicted for every team at the end of the season. All we have to do is translate it into actual points. However, the next steps are not as simple and involve some wacky assumptions.
3.- How Many Possible Points Can a Team Get? In theory, if a team today won all 38 games, they would have a total of 114 points (3 points per win). However, due to the way this formula was derived, we need to assume that a win is only worth 2 points (Fun fact: This was the official measurement for wins up to 1994). Therefore, we operate under the assumption that if a team won all 38 games, they would only get 76 points.
4.- Calculate the Final Predicted Points Since we have our percentage of points predicted per team and the total points a team could get, we multiply them in order to get the predicted points for every team at the end of the season. However, you will notice these numbers are extremely low. That is because we are still operating under the 2 point system, which means we need to adjust it back to the 3 point system we are familiar with.
5.- Getting Our Adjusted Predicted Points This step is not as complicated as it sounds. All we need to do here is take the current, real world points for every team and convert them into our 2 point system. All you need to do here is take the team’s real world current points and subtract the number of wins that team has. Another more intuitive way to do this is by multiplying the number of wins by 2 and adding the number of draws the team has.
6.- Converting Into the 3 Point System Once again, it is time to trust blindly in the math. While its derivation is not that complicated, this formula allows us to adjust the predicted points from the previous step. Now we get to see what the final expected points for every team at the end of the season and compare them to the points they currently have.

As you can see, our predictions differ from the actual current points by only 1 or 2 points, and some are even spot on! How you choose to interpret the information is entirely up to you.
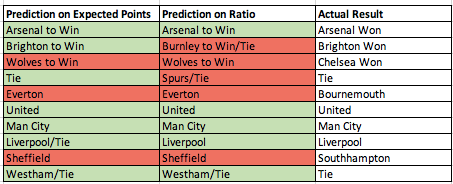
One of the many things I did with this data was to calculate the difference between actual points and expected points and see if a team was performing better or worse than expected. This way, I could see which teams were underperforming and were expected to either win or tie their next games.
By doing this (and using other metrics and some subjectivity), I was able to predict the outcome of 7 out of the last 10 games of the season, including Brighton’s upset and first win after losing 4 in a row, and the 1–1 tie between Tottenham and Crystal Palace!