
Microsoft launches new Data Analysis Tool named Explore
How you can now easily explore Data with Power BI

Microsoft just launched a new Data Analysis tool called Explore, which is integrated into Power BI.
In Power BI, users often find themselves in need of spontaneous data exploration. This scenario might involve an analyst gaining access to a fresh dataset or source and wanting to delve into the data before constructing a comprehensive report.
Alternatively, it could be a business user seeking to address a specific query using data for inclusion in a PowerPoint presentation, but finding that the existing report doesn’t precisely address their question. In such cases, initiating a new report from scratch presents a significant obstacle, especially when a quick answer or a snapshot for a presentation is required[1].
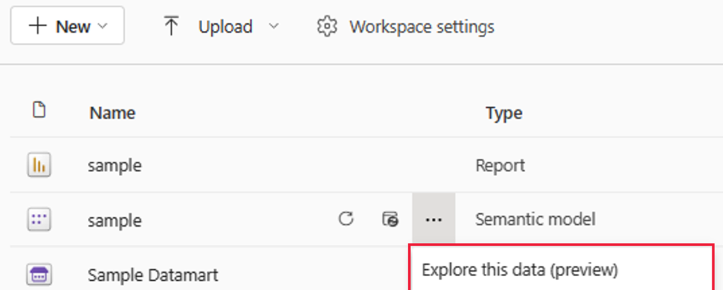
This feature provides users with a streamlined and focused interface for data exploration. Much like exporting data or creating a PivotTable in Excel, Power BI now enables users to swiftly access Explore, allowing them to promptly generate a matrix or visualize data to obtain the required answers.
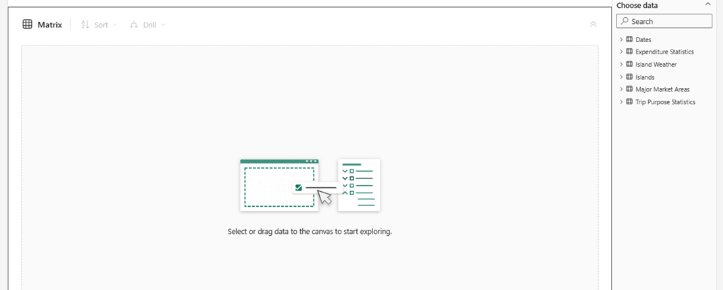
This direct approach minimizes distractions and unnecessary complexities commonly associated with building complete reports[1][2]. Keep in mind that the feature is now in preview but for some PoC or testing, you surely can use it already now.
So this is clearly a new and very useful feature which Microsoft is providing its Power BI users. Often, you just want to explore data from a Data Lake, Data Warehouse or a (big) Excel or CSV Sheet. With this tool, it's now easier to get a first oversight over this kind of data. To dive deeper, please use the link down below.
Sources and Further Readings
[1] Microsoft, Empower Power BI users with Microsoft Fabric and Copilot (2023)
[2] Microsoft, Introducing Explore (Public Preview) (2023)


