
Matplotlib Animations in Jupyter Notebook
Creating animation graph with matplotlib FuncAnimation in Jupyter Notebook

Matplotlib is one of the most popular plotting libraries for exploratory data analysis. It’s the default plotting backend in Pandas and other popular plotting libraries are based on it, for instance, seaborn. Plotting a static graph should work well in most cases, but when you are running simulations or doing time-series data analysis, basic plots may not always be enough. You may want to show an animation that helps you understand how the state changes over time.
In this article, you’ll learn how to create animations using matplotlib in Jupyter Notebook. This article is structured as follows:
- Interactive Plot in Jupyter Notebook
- Embedded HTML5 video in Jupyter Notebook
Please check out the Notebook for source code.
For demonstration, we will be creating a moving sine wave, and below is one frame example:
import matplotlib.pyplot as plt
import numpy as np
x = np.linspace(0, 2*np.pi, 100)
y = np.sin(x)plt.plot(x, y)
plt.show()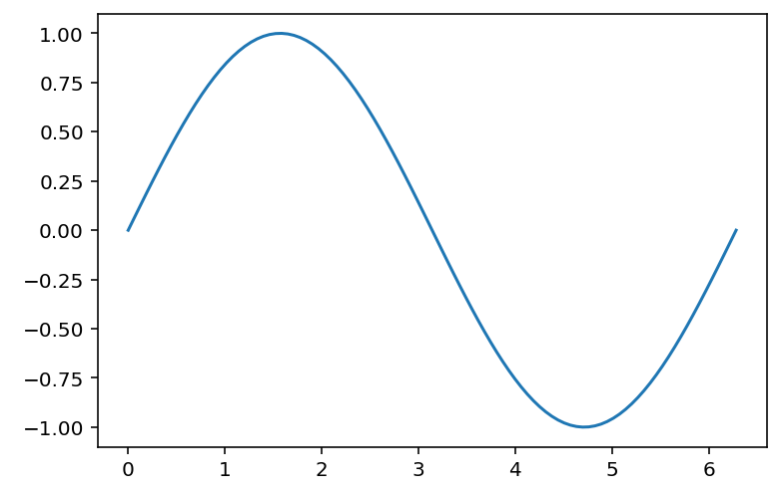
1. Interactive Plot in Jupyter Notebook
In order to create an interactive plot in Jupyter Notebook, you first need to enable interactive plot as follows:
# Enable interactive plot
%matplotlib notebook
After that, we import the required libraries. Especially FuncAnimation class that can be used to create an animation for you.
import matplotlib.pyplot as plt
from matplotlib.animation import FuncAnimation
Next, we need to create an initial state of the animation figure. We call subplots() without any arguments to create a Figure fig and a single Axes ax. We set the x range to (0, 2*Pi) and y range to (-1.1,1.1) to avoid them to be constantly changing.
fig, ax = plt.subplots()line, = ax.plot([]) # A tuple unpacking to unpack the only plotax.set_xlim(0, 2*np.pi)
ax.set_ylim(-1.1, 1.1)We then create a function animate() that’s going to be called by the FuncAnimation. The function takes one argument frame_num — the current frame number. What we want to do here is to change data for our line according to the frame number.
def animate(frame_num):
    y = np.sin(x + 2*np.pi * frame_num/100)
    line.set_data((x, y))
    return line
Finally, we create our animation object by calling FuncAnimation with 4 arguments
- The first argument
figis the reference to the figure we created - The second argument
animateis the function we created to call at each frame to update the plot. - The third argument is
frames=100, and it defines the number of frames for “one round of animation” - Finally, the
interval=20argument sets the delay (in milliseconds) between frames.20is equivalent to50FPS(1000ms / 20 = 50 FPS). If the number is too large you wait a really long time, if the number is too small, it would be faster than your eyes could see. In general, we need FPS greater than 16 for smooth animation (Human eyes can only receive 10–12 frames [1]).
anim = FuncAnimation(fig, animate, frames=100, interval=20)plt.show()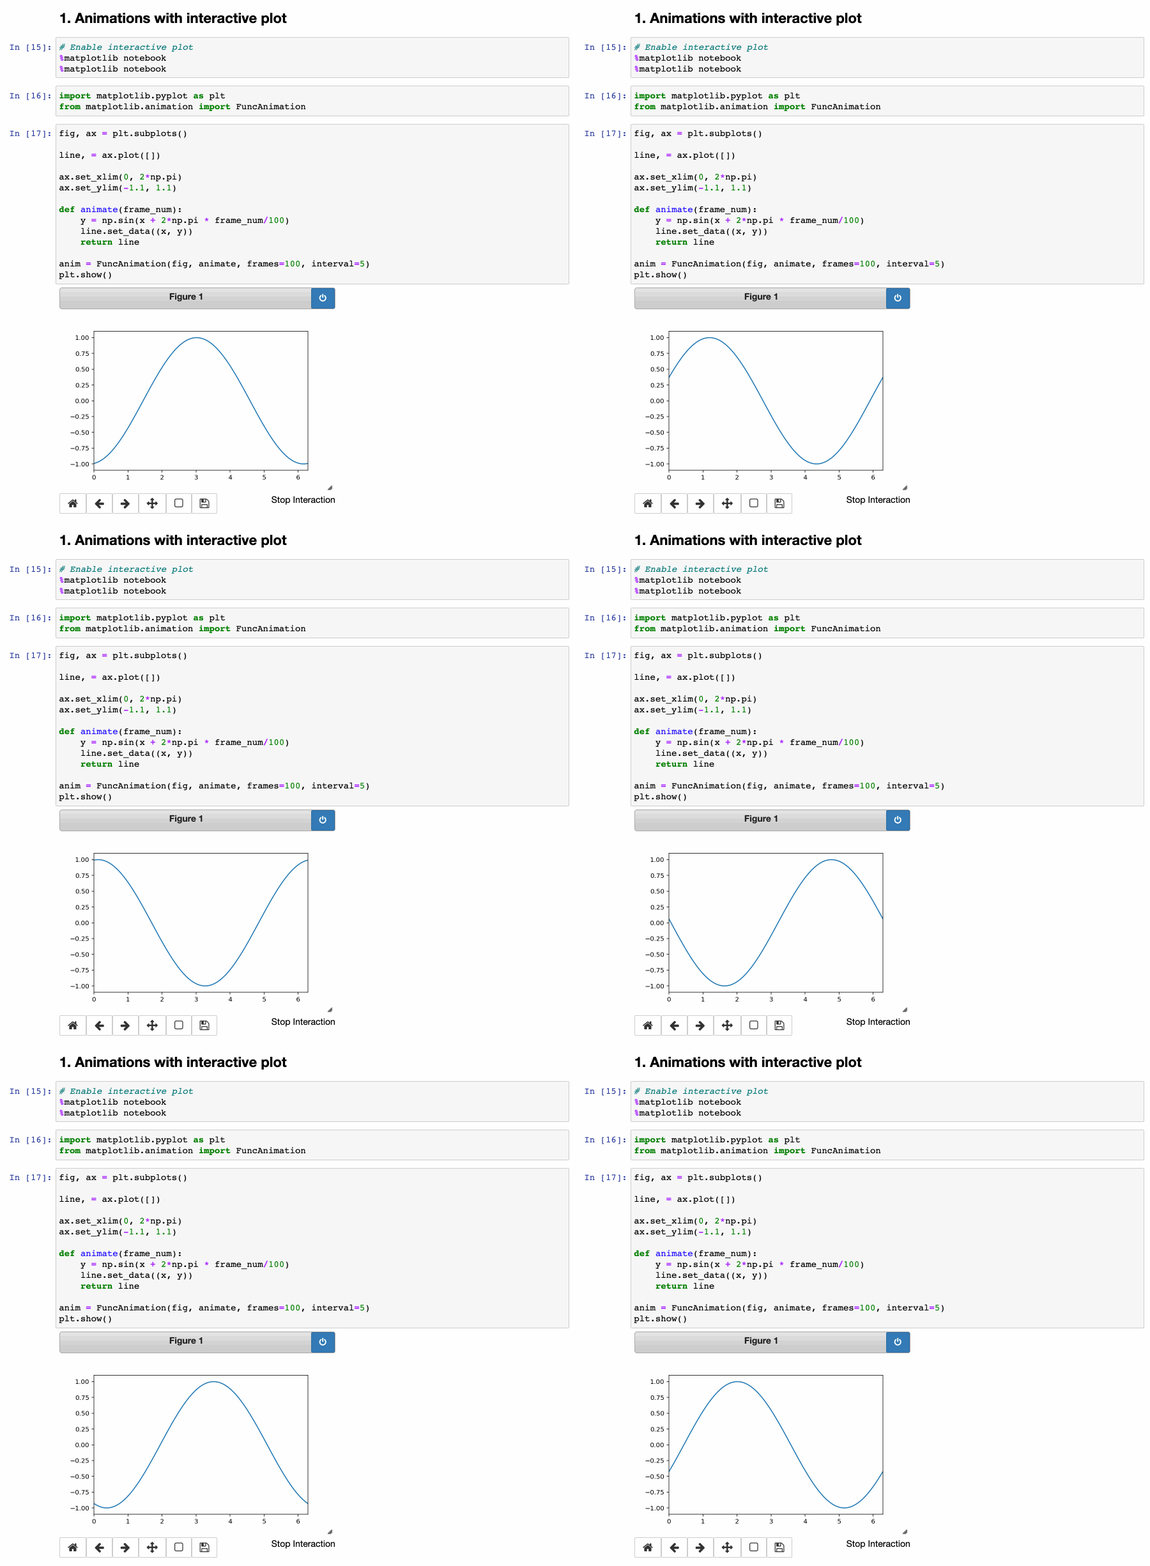
Please check out Notebook for the source code
2.Embedded HTML5 video in Jupyter Notebook
In the previous example, we have created a nice sine wave animation. However, the plot is animating only when the code is running. Of course, we could take a screen capture, but that’s not efficient when you want to share your Jupyter Notebook online.
What we can do is convert the animation into an HTML5 video and embed it in Jupyter Notebook. We will be using FFmpeg for conversion. If you don’t have it, you first need to follow the instruction to download FFmpeg and unzip it.
After that, we import the required libraries and set 'ffmpeg_path' to the path to your local ffmpeg executable:
import matplotlib.pyplot as plt
from matplotlib.animation import FuncAnimation
from IPython import displayplt.rcParams['animation.ffmpeg_path'] = '/path_to_your/ffmpeg'Creating animation is the same as the previous example.
fig, ax = plt.subplots()line, = ax.plot([]) # A tuple unpacking to unpack the only plotax.set_xlim(0, 2*np.pi)
ax.set_ylim(-1.1, 1.1)def animate(frame_num):
y = np.sin(x + 2*np.pi * frame_num/100)
line.set_data((x, y))
return lineanim = FuncAnimation(fig, animate, frames=100, interval=20)But instead of plt.show() to plot it, we are calling anim.to_html5_video() method to convert the animation result into an HTML5 video. We then need to get the HTML code that does the embedding for this video and that is done by calling IPython display.HTML(video). Finally, we call display.display(html) to embed the HTML code in Jupyter Notebook.
video = anim.to_html5_video()
html = display.HTML(video)
display.display(html)
plt.close()                   # avoid plotting a spare static plot
Please check out Notebook for source code
Conclusion
In this article, we have learned 2 approaches to create matplotlib animation in Jupyter Notebook. Creating an animation plot can help you running simulations and doing time-series data analysis.
I hope this article will help you to save time in learning matplotlib. I recommend you to check out the documentation for more options & setting and to know about other things you can do.
Thanks for reading. Please check out the notebook for the source code and stay tuned if you are interested in the practical aspect of machine learning.
You may be interested in some of my other Data Visualization and Pandas articles:
- Python Interactive Data Visualization with Altair
- Interactive Data Visualization for exploring Coronavirus Spreads
- 10 tricks for converting numbers and strings to Datetime in Pandas
- All Pandas json_normalize() you should know for flattening JSON
- Using Pandas method chaining to improve code readability
- How to do a Custom Sort on Pandas DataFrame
- All the Pandas shift() you should know for data analysis
More tutorials can be found on my Github


