
Marketing Mix Modeling: Response Curves and Budget Optimization

Marketing Mix Modeling Series
Part 1: The Art of Measuring Marketing Effectiveness Part 2: 7 Metrics to Use and Boost Your ROI Part 3: Choosing Causal Variables and KPI Part 4: Transform Your Marketing Data with Carryover, Lag, and Saturation Part 5: Strategies to Control Bias in Marketing Mix Models Part 6: Hands-on with Bayesian MMM using PyMC Part 7: Response Curves and Budget Optimization
By now, we’re hopefully comfortable building and evaluating our own marketing mix models. But how are these results really consumed? Read on!
Response Curves
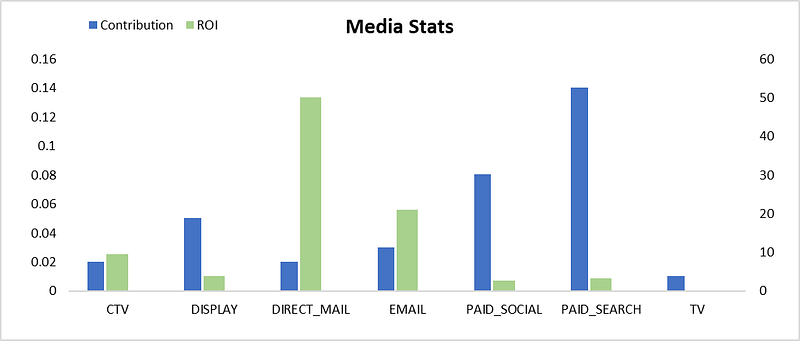
Before we get into response curves itself, let’s change our thinking to reflect business — instead of contributions, business is more interested in learning the ROI (return on every dollar spent).
As you will see, owned media like Email and Direct Mail have a very high ROI because we spend the least on them. In comparison, paid media like Paid Search and Paid Social mass-pullers but also expensive.
Response curves in marketing are graphical representations of how different levels of marketing spend affect the desired outputs, such as sales or profits. They help marketers to optimize their marketing mix and allocate their resources efficiently. Response curves can vary depending on the type of product, market, and customer segment. Some common types of response curves are S-shaped, concave, convex, and linear.
Since we used a Hill transformation in the earlier parts, our curves will be slightly S-shaped. The X-axis is spend and Y-axis is the incremental revenue it generates. The orange dot is our current spend in the period.
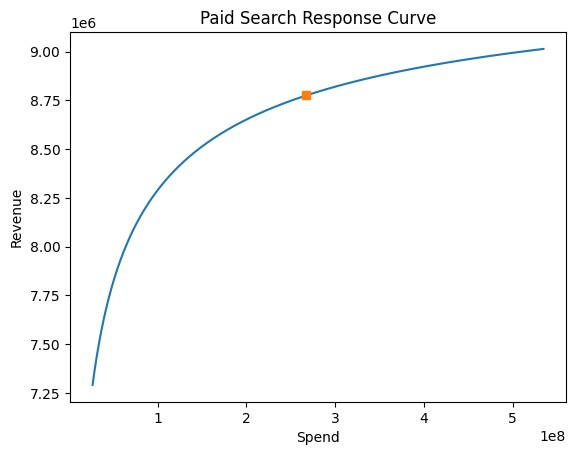
Curves like these for every media help marketers understand whether their current spends are saturated or there is still some room for increase. In image above, the current spend is in the saturation zone, which means every dollar increase in spend will bring very little incremental revenue.
Budget Optimization
Our current media budget is $7,067,871,398 ($7B) which brought in $13,011,923,953 ($12B) in incremental revenue. If we increase the budget by 5%, where can we allocate the additional dollars? Do we need to direct money out of any of the low-performing channels? What is the additional revenue we expect to get from this new budget?
Gurobi is a powerful optimization software that can help you build a marketing budget optimizer. A marketing budget optimizer is a tool that allocates your marketing budget across different channels and campaigns to maximize your return on investment (ROI). To build a marketing budget optimizer using Gurobi, you need to follow these steps:
- Define your decision variables. These are the amounts of money you want to spend on each channel or campaign.
- Define your objective function. This is the expression that measures your ROI based on your decision variables and some parameters such as conversion rates, costs, and revenues.
- Define your constraints. These are the limitations or requirements that you have to satisfy with your decision variables, such as budget limits, minimum or maximum spending levels, or target outcomes.
- Solve the optimization problem using Gurobi. This will give you the optimal values for your decision variables that maximize your objective function while satisfying your constraints.
- Analyze the results and implement the optimal solution. You can use Gurobi’s reporting and visualization features to understand the trade-offs and sensitivities of your solution, and then use it to guide your marketing budget allocation.
Let’s create a simple optimizer with the constraint that new media spend be within +-25% of current spend.
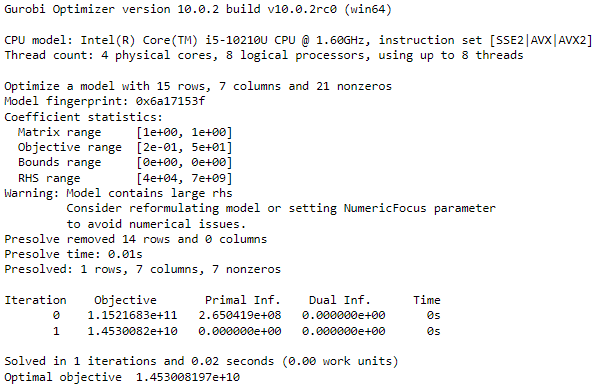
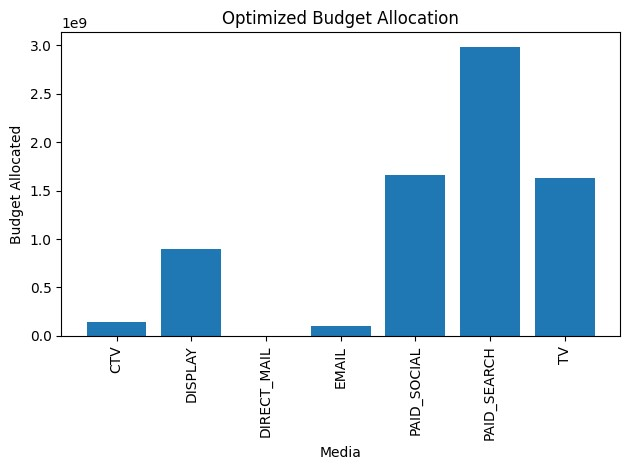
We see that the optimized allocation would bring us $14,530,081,968 ($14.5B) revenue in the period. We could see where the budget is allocated through a chart.
By using a marketing budget optimizer such as this, you can:
- Save time and resources by letting the tool handle the budget allocation and pacing for you. - Maximize your return on investment by focusing on the most profitable and relevant channels and campaigns for your audience. - Gain insights and transparency into your marketing performance and spend across different platforms and publishers. - Adapt to changing market conditions and customer behavior by allowing the tool to adjust your bids and budgets accordingly.
This brings us to the end of the Marketing Mix Modeling series. Hope you feel confident in building your own MMM solutions, having the right conversations and being a data-driven marketer.
Thank you for reading :)


