
Democratizing Machine Learning
Machine Learning with SQL
How to realize Machine Learning with BigQuery ML

Most Data Scientists and Engineers have to learn SQL anyway, wouldn’t it be cool to develop Machine Learning models with SQL? Google’s BigQuery ML lets you build and run machine learning models in BigQuery using standard SQL queries. BigQuery ML democratizes machine learning by allowing SQL users like Data Scientists and Analysts to build models using existing SQL tools and capabilities.
What can BigQuery ML do?
With BigQuery ML Data Analysts can use existing SQL tools to leverage machine learning. With BigQuery ML, ML models can be created and evaluated in BigQuery. It eliminates the need to export small amounts of data to spreadsheets or other applications, or wait for limited resources from a Data Science team.
With BigQuery ML you can develop models like:
- Linear Regression — for example for forecasts
- K-Means — Clustering for data segmentation
- Deep learning neural network (DNN) — For creating TensorFlow-based deep learning neural network, etc.
Here, you find a whole guide: What is BigQuery ML? [1].
Bring the Compute to the Data
The whole thing is under the concept “Bring Compute to the Data”. Especially, since the big providers like Google, Amazon and Microsoft link services such as databases and Data Warehouses with machine learning services, it is no longer necessary to integrate the data into other platforms or systems. In services like Google’s BigQuery, traditional database systems are extended internally with ML tools. Advantages of the new approach include a simplified infrastructure and data integration process. Every Data Scientist and Data Engineer knows how time consuming the process can be — so the approach of having everything you need in a cloud environment or even in a service simplifies this process significantly.
Example with BigQuery ML
Now let us apply the whole thing to a specific example. I have created a machine learning model with the help of the dataset Iowa liquor sales where I have created a clustering. You can find the data within BigQuery as a public dataset. By the way, you can use BigQuery and also BigQuery ML for free in the Free Tier [2] , sign up and you can try it for yourself right now.
Step 1 — Create the Model
The first step is to create the the model for example like that:
CREATE OR REPLACE MODEL DATA.iowa_bottle_clusters OPTIONS (model_type='kmeans',num_clusters=3, distance_type = 'euclidean') AS
SELECT
 item_description,
 AVG(state_bottle_cost) AS state_bottle_cost
FROM `bigquery-public-data.iowa_liquor_sales.sales`
WHERE
 EXTRACT(YEAR FROM date) = 2018
GROUP BY
 item_description;
Above, you can see that I used the k-Means algorithm and set the parameter for the number of clusters to three. My idea for this, as I said, highly simplified example is simply to use the variable state_bottle_paid (The amount that Alcoholic Beverages Division paid for each bottle of liquor ordered) to divide it into three price categories.
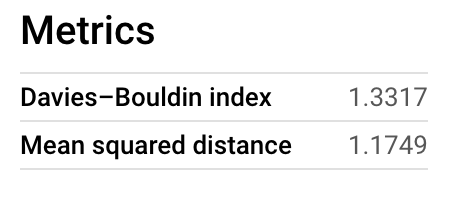
Step 2 — Evaluate Model
After creating the model, BigQuery automatically provides you with some metrics. These allow an evaluation of clustering algorithms. For the Davies-Bouldin index, the goal would be the lowest possible value [3].
Step 3 — Predict
Via ML.PREDICT, we will see which cluster a particular brands belongs to.
SELECT
 centroid_id,
 item_description,
 state_bottle_cost
FROM
 ML.PREDICT(MODEL Data.iowa_bottle_clusters,(SELECT
  item_description,
  AVG(state_bottle_cost) AS state_bottle_cost
 FROM
  bigquery-public-data.iowa_liquor_sales.sales
 WHERE
  date <= '2018-02-02'
  AND date >='2018-01-01'
 GROUP BY
  item_description) )
 ORDER BY
  centroid_id;
Step 4 — Examine the Results
Now let’s check if the result make any sense (sure it’s a very simplified example) but let’s see. Here, are examples from the three clusters:
Only one item in the first cluster which seems to be the high class product:
1 — Remy Martin Louis Xiii Cognac — 1599.19
In the second group we have way more bottles — which seems to be considered as middle class — e.g.:
2 — The Dalmore Cigar Malt Scotch — 93.33
2 — Kavalan Sherry Oak Single Malt — 73.33
2 — Jim Beam Distillers Masterpiece — 104.91
And a cluster with products you would probably drink with coke or other mixtures:
3 — Smirnoff Grape — 8.25
3 — Smirnoff Sours Green Apple — 8.25
3 — Burnett’s Fruit Punch — 4.48
So the results are not that bad in the end, but could be of course optimized. All you need here for is BigQuery and some basic SQL.
Summary and Outlook
BigQuery ML is a powerful weapon in the field of Machine Learning. It is so easy to implement machine learning models with SQL. This has several advantages. Firstly, it only requires SQL, so no additional experts with Python or R knowledge may be needed. Especially today, when companies are struggling for experts, this can be an immense advantage. Furthermore, there is no need for a complex data integration or extraction process. The data is stored on the Google Cloud in BigQuery and can be used there for analyses. I am particularly impressed by the speed with which these ML models can be created, trained and executed. Since BigQuery is also offered in the cloud as a SaaS solution, the whole thing is of course scalable and therefore fast and relatively inexpensive even for complex analyses.
To dive deeper into this topic this articles might eb also interesting for you:
Sources and Further Readings
[1] Google, What is BigQuery ML? (2021)
[2] Google, Free Tier (2022)
[3] Davies, D.L., Bouldin, D.W. (1979). “A Cluster Separation Measure”. IEEE Transactions on Pattern Analysis and Machine Intelligence. PAMI-1 (2), S.224–227.