
Lighthouse: A Performance and Optimization Tool for Webpages
A useful tool to improve the quality of your webpages
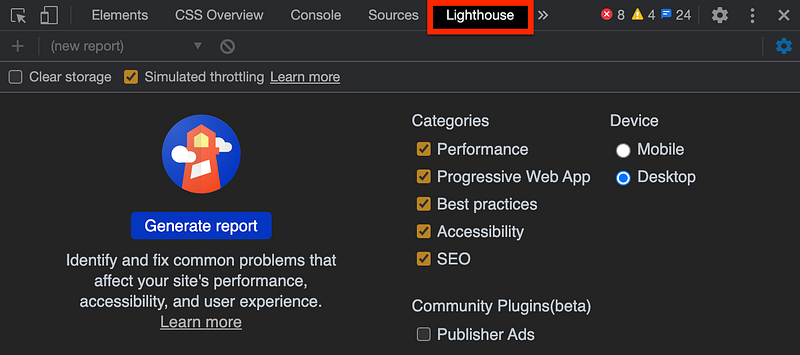
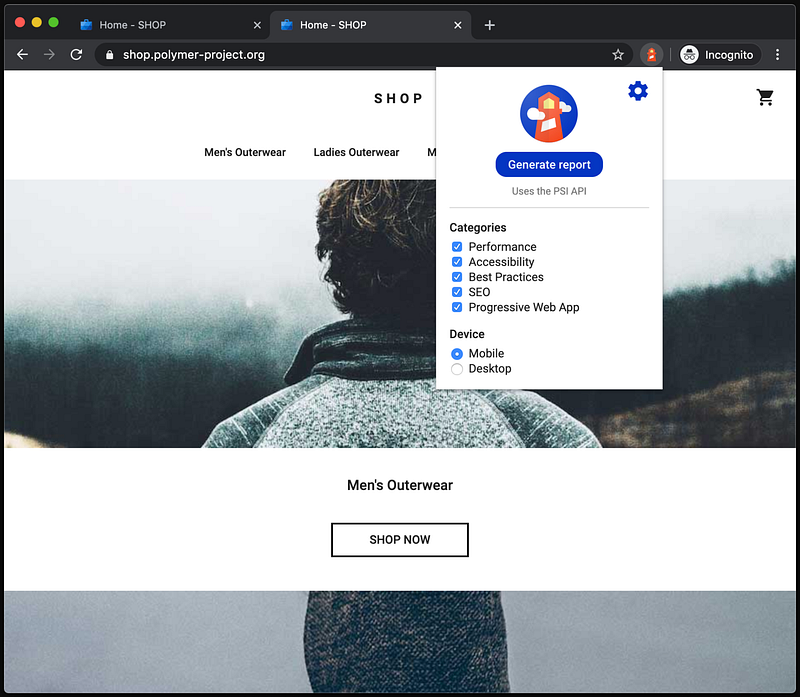
When opening Chrome DevTools, you will see this highlighted tab in the above image. What is it? It’s Lighthouse, an open-source automated tool for improving the quality of webpages.
By default, it measures performance, progressive web app, best practices, accessibility, and search engine optimization (SEO), although you can adapt them to your needs by checking and unchecking items in Categories.
We chose the Device type to be Desktop for our use cases.
There is also the ‘Clear storage’ button at the top-left corner. It has been hidden well, but we found the setting button to unhide it at the top-right corner. It has been unchecked. Otherwise, it ends up testing login pages with user information to be cleared.
Lighthouse is easy to use, and it produces quite accurate measuring data. Following the suggestion in the report card, we can improve performance, accessibility, and other aspects of webpages. It is a highly recommended tool for web developers.
Measure a Website
Let’s measure the Lighthouse website using Lighthouse:
After clicking the ‘Generate report’ button, it produces the following report card for the selected webpage:
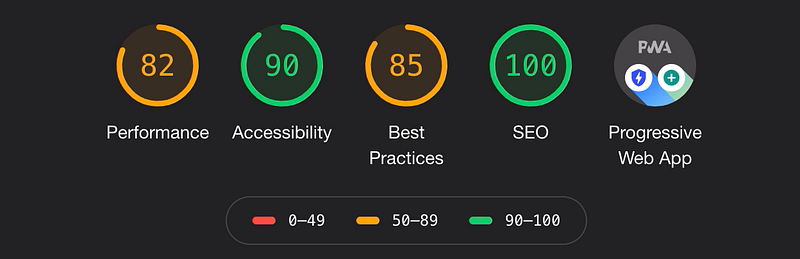
The scores are colored according to these ranges:
- 0 - 49 (red): Poor
- 50 - 89 (orange): Needs improvement
- 90 - 100 (green): Good
To provide a good user experience, websites should strive to have a score above 90.
We go through each section to see how to interpret these scores.
Performance score
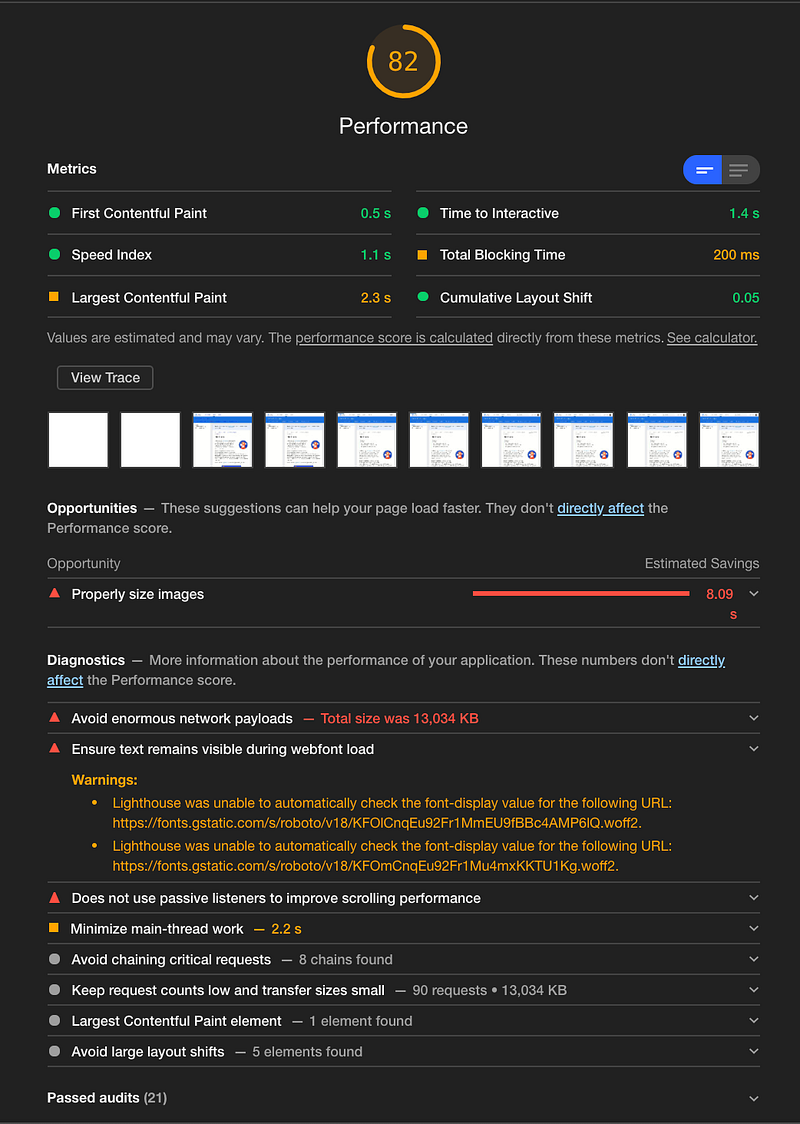
The above is the performance scorecard, which is composed of six metrics:
- First Contentful Paint: It marks the time at which the first text or image is painted.
- Speed Index: It shows how quickly the contents of a page are visibly populated.
- Largest Contentful Paint: It marks the time at which the largest text or image is painted.
- Time to Interactive: It is the amount of time it takes for the page to become fully interactive.
- Total Blocking Time: It is the sum of all time periods between First Contentful Paint and Time to Interactive.
- Cumulative Layout Shift: It measures the movement of visible elements within the viewport.
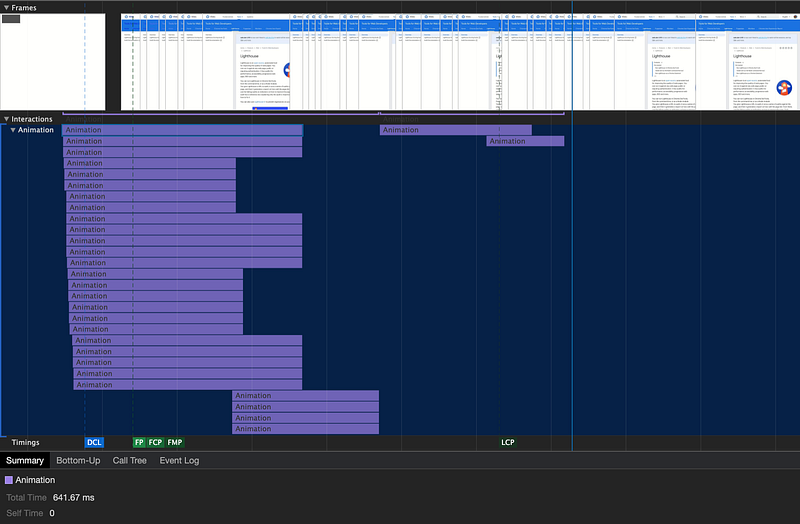
Under the Metrics section, there are a number of snapshots to show how this webpage gets loaded. Clicking the View Trace button will go to the Performance tab where loading details are traced:
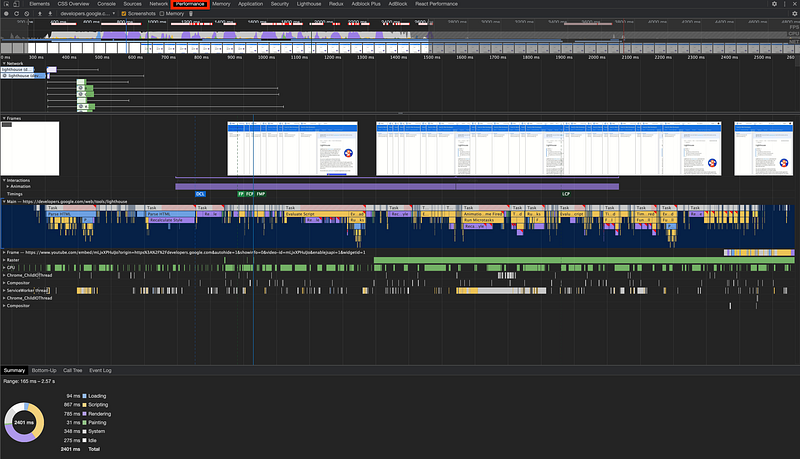
The above table includes rich information. For example, if we go to Largest Contentful Paint area, we can zoom in and find out the animation loading time.
‘Opportunities’ in the scorecard are suggestions to help the page loading faster. One of the suggestions is about properly sizing images. Open this item, and we see the five largest images:
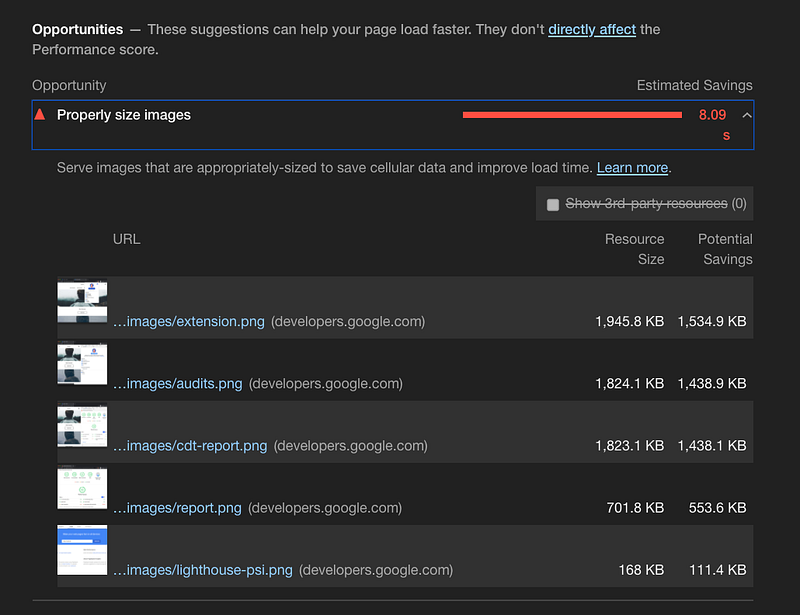
Click on the link of the largest image. It’s a surprise to find out the Men’s Outerwear advertisement.
Rerunning the report, surprisingly, we get a performance score of 100. Running it again, the score comes back to around 82.
What happened?
There are many facts that affect the score. It is possibly caused by A/B tests, changes in the advertisement being served, internet traffic routing changes, etc.
Accessibility score
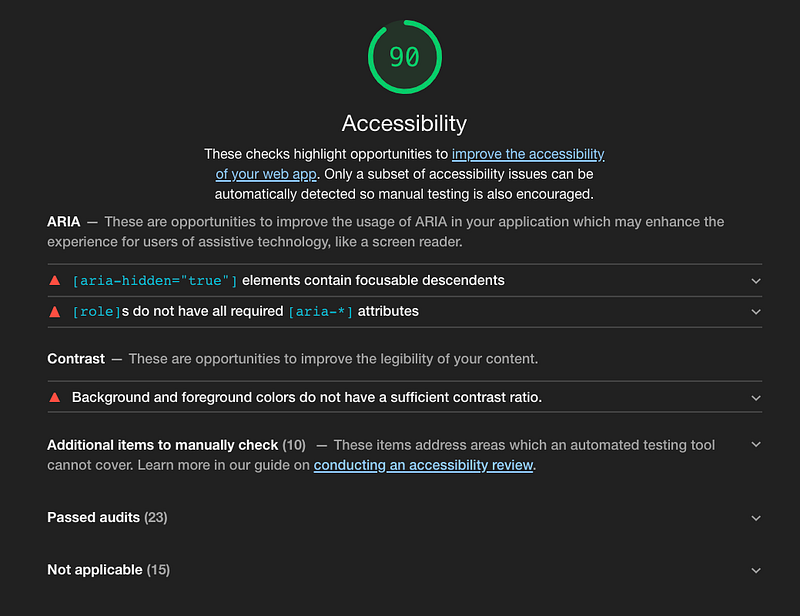
The above is the accessibility scorecard, which displays accessibility opportunities. Here it shows two ARIA improvement recommendations and one suggestion for contrast colors.
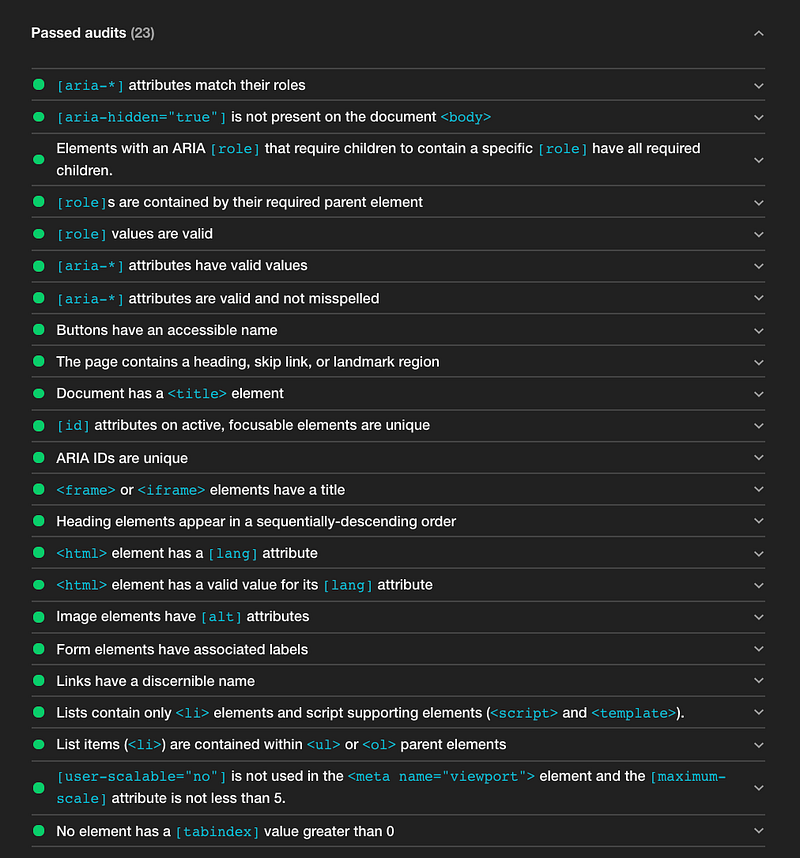
This is a list of passed audits:
Another list of not applicable items:
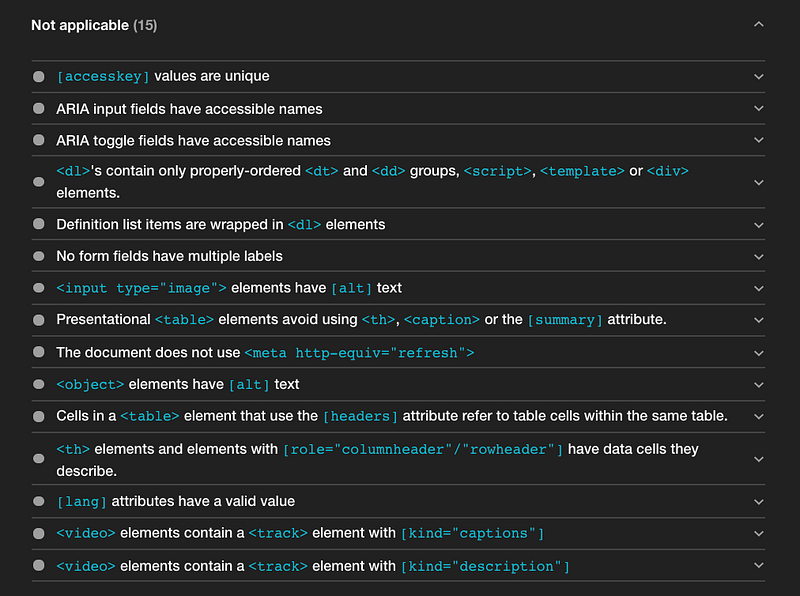
Together, it exhibits all the accessibility criteria used by Lighthouse. It captures most of the measurements mentioned in 10 Steps to Building Web Applications With Accessibility (a11y).
Best practices score
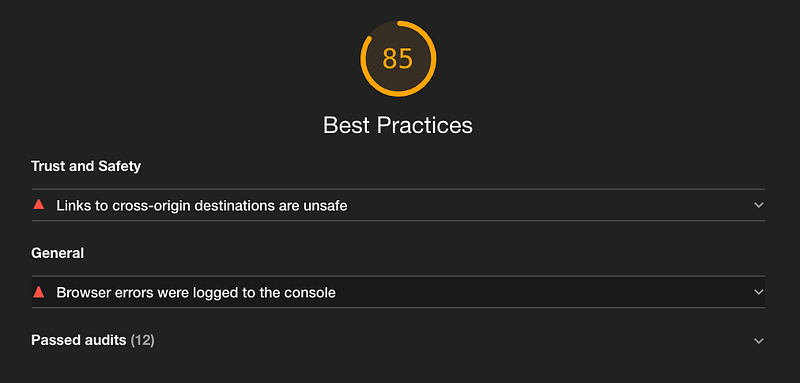
The above is the best practices scorecard, which checks opportunities to improve the overall code health of webpages.
It points out two issues: Some cross-origin destinations are unsafe, and there are a number of browser errors.
The passed audits show what other things are verified against best practices:
- Uses HTTPS
- Avoids requesting geolocation permission on page load
- Avoids requesting notification permission on page load
- Avoids front-end JavaScript libraries with known security vulnerabilities
- Allows users to paste into password fields
- Displays images with the correct aspect ratio
- Displays images with the appropriate size
- Page has the HTML doctype
- Properly defines charset
- Avoids application cache
- Detected JavaScript libraries
- Avoids deprecated APIs
SEO score
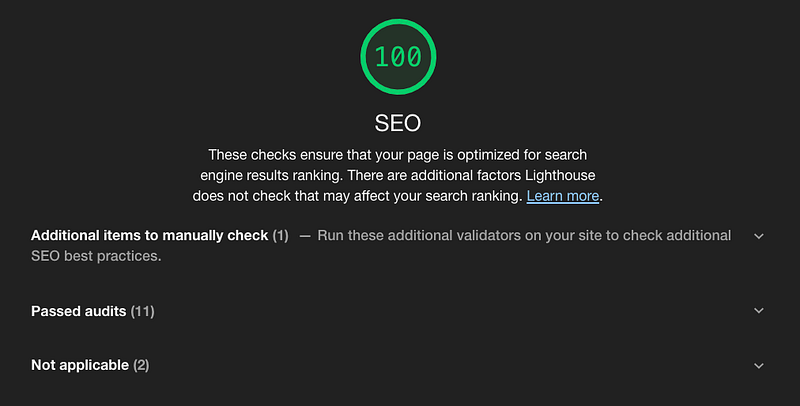
The above is the search engine optimization scorecard, which checks whether the page is optimized for search engine results ranking.
These are criteria used by Lighthouse:
- Has a
<meta name=”viewport”>tag with width or initial-scale (mobile friendly) - Document has a
<title>element - Document has a meta description
- Page has successful HTTP status code
- Links have descriptive text
- Page isn’t blocked from indexing
robots.txt, a file tells search engines which pages can be crawled, is valid- Image elements have
[alt]attributes - Document has a valid
hreflang - Document has a valid
rel=canonical, which tells search engines that it is the same as the canonical URL - Document avoids plugins
- Document uses legible font sizes
- Tap targets are sized appropriately
PWA Score
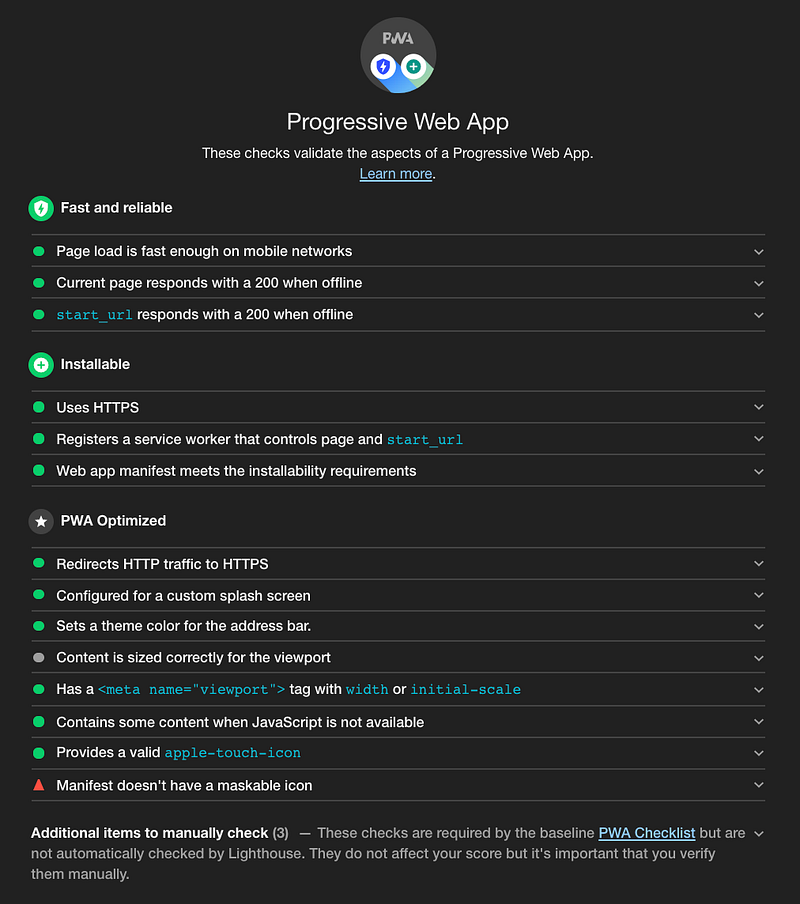
The above is the progressive web app scorecard, which provides insights and feedback on a web app for PWA features. It provides a set of metrics to help build a PWA for the full application-like experience.
Lighthouse tests applicable PWA criteria:
- Starts fast and stays fast
- Is installable
- Works in any browser
- Responsive to any screen size
- Provides a custom offline page
- Is fully accessible
- Can be discovered through search
- Works with any input type, such as a mouse, a keyboard, a stylus, or touch
- Provides context for permission requests
- Follows best practices for healthy code
Conclusion
Lighthouse is a useful tool to measure and optimize our products. It is a click away with Chrome DevTools.
It is also available as a command-line tool or as a node module:
npm install -g lighthouse
lighthouse --help
or npm install --save-dev lighthouse
In addition, Lighthouse CI is a suite of tools that enable continuously running, saving, retrieving, and asserting against Lighthouse results.
Are you ready to try it out?
Thanks for reading. I hope this was helpful. You can see my other Medium publications here.


