
Lessons from 2 Months of Profitable Day Trading
Now that I’ve made over 50 day trades with the algorithm discussed here, it’s time to discuss results and possible areas for improvement. My premarket day trading strategy has continued to beat the market, even when we consider fees and taxes. Although buying and holding the S&P 500 would eliminate taxes, my strategy has yielded higher returns even at the highest income tax bracket. This has been the case for most of the past 2 months, and I have plans to keep this momentum going.
I won’t be going into the details of my strategy (it’s already linked above)—let’s just look at the results before getting to some self-criticism.
Results
The S&P 500 has shown strong growth since I started real-time implementation, proving to be quite the competitor to any trading strategy. Since November 9, it’s increased 12.2% in price. Post-tax, this gain would remain 12.2% assuming you didn’t sell, and as low as 9.8% if you sold and applied the maximum long-term capital gains tax of 20%.
Let’s consider the 0% tax which would come from buying and holding the market, since it best reflects the standard philosophy of investors and also sets the strictest standard for my benchmark. To match S&P 500 returns with a 37% short-term income tax rate, I would have needed an 19.4% yield from my strategy starting on November 9.
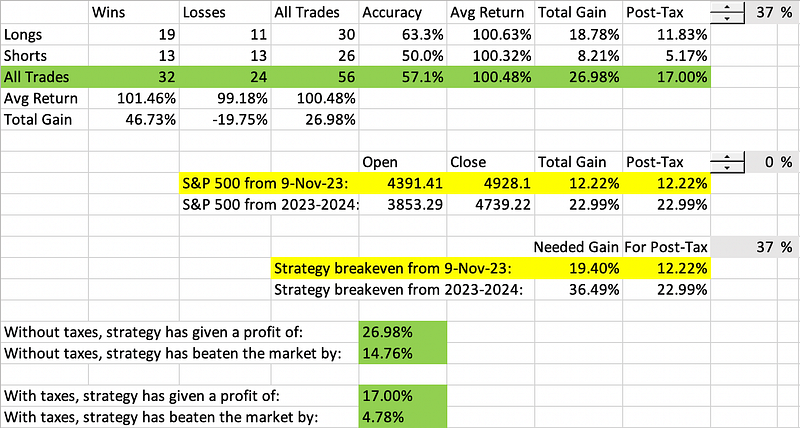
In reality, my strategy has made around a 27% gain since that date, so before taxes I’ve beaten the market by around 14.8%. At the highest income bracket (which I’m decidedly not in), we’d still see a 17% gain, which surpasses the S&P 500 by 4.8% post-taxes.
Suffice it to say I’m grateful that I’ve been able to come up with a disciplined — and purely algorithmic — trading strategy which has worked well so far. I’m also pleased to see that my trades last a median time of 4 minutes, meaning my time exposed to the market is very low and margin fees will be minimal as I continue to scale up.
But I’m not here to brag or celebrate. We’ll just go over some more results.
- I took around the same number of positions in either direction, with 30 long trades and 26 short trades. Overall, my accuracy was around 57%, which doesn’t seem great but is about as good as many hedge funds. I was held back by shorts, which were really a coin flip at 50% accuracy.
- As I stated in my previous post, this potential for random chance is why it’s important to set a profit-loss ratio in your favor. I’ve been using a 2:1 ratio for most trades, and have recently implemented a dynamic kind of trailing stop loss to let the profits run even more when possible.
- The average return from each trade was around half a percent, which for a day trader is pretty respectable but could have been higher had I automated the closing of my trades sooner. Unfortunately, Fidelity has a caching issue which prevents me from closing trades immediately, leading me to consider a switch to a broker with an actual API, like Interactive Brokers. (The drawback there is that trading fees are much higher, and these fees compound at the same rate as profits.)
- Diversification, while difficult to implement due to Fidelity’s cache refresh delay, has already started to prove useful. It has allowed me to avoid putting all my eggs in one basket and let profits run for the best stock(s) of the day.
- As stated, the median time exposed to the market was just 4 minutes per trade. Most often I had the computer open a position seconds after 9:30 and close it before 9:35. There were a couple exceptions, like a shortened session around the holidays when I held the bulky, slow-moving Salesforce for the entire day only to make only a .1% profit. (One of the most boring days of my life.)
Let’s talk a bit more about market exposure, since I think it’s one of the key issues surrounding my strategy and investing in general.
Market Exposure
Across 56 trades made over 2 months, I spent only 14 hours with money actually tied up in the market. That’s barely 2 regular trading sessions. (The rest of the time, my free cash has been making 5% from Fidelity’s money market, completely risk-free.) So I’m seeing that, contrary to popular belief, it may actually be possible to time the market. It’s a lot harder than just buying S&P 500 and waiting, but clearly it can be profitable and a robust way to avoid unexpected intraday losses.
So far we’ve only considered time exposure, not money exposure. Making trades during the most volatile few minutes of the day is risky, and I haven’t exactly been playing with small amounts. In fact, considering each trade as a separate risk, I found that my cumulative exposure was more than my net worth by around $100k. That’s a lot of money to risk over 14 hours. Of course, it wasn’t anything like gambling — unless you’re the kind of gambler who backtests strategies across thousands of games before deciding which one to play. But risk is still risk, and it’s important to note.
So how can I continue to mitigate risk while making decent profits? I’ll end this post by discussing how I could be using broader market dynamics to make better decisions.
Market Dynamics
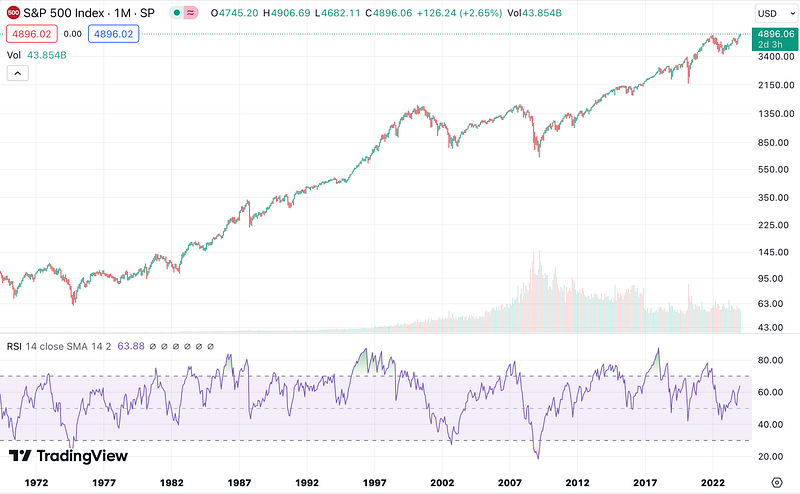
The market is currently being hyped-up as a bull market by some due to new highs, prospects of decreasing inflation, etc.
November (+9%) was a bit of an outlier month — it was the best November we’ve had since 2020 (+11%) and the best overall month since July 2022 (+6.5%). Then we experienced a Santa Claus rally as usual, sending the price above its previous high. And the cooldown into the new year seemed reasonable. Technically speaking, the market really is stronger than ever.
There should be some concern that big tech is still laying off employees en masse and falling short on acquisitions — for example, Adobe will no longer be buying Figma, and Microsoft just cut 8% of its gaming division. These people need to work in order to stimulate the economy, but Wall Street doesn’t bat an eye at this, and in fact tends to celebrate leaner companies. (The tech giant I worked for saw its best month in 20 years when I was laid off in 2022, but I’m not mad — I had my own share in the company).
In any case, my trades should more closely reflect the fact that there have around twice as many “long” days for S&P 500 as “short” days in the past 2 months. My accuracy would likely have been higher had I bought on days S&P was trending upwards, since an opposing short position would have had to fight the sway of the broader market. This is a feature I attempted to implement early on, but I was using a data provider with a 1–2 minute delay, so it was impossible to make decisions right at 9:30. Since I’m now using Fidelity to get even the premarket prices in real-time, I should be able to work this in soon.
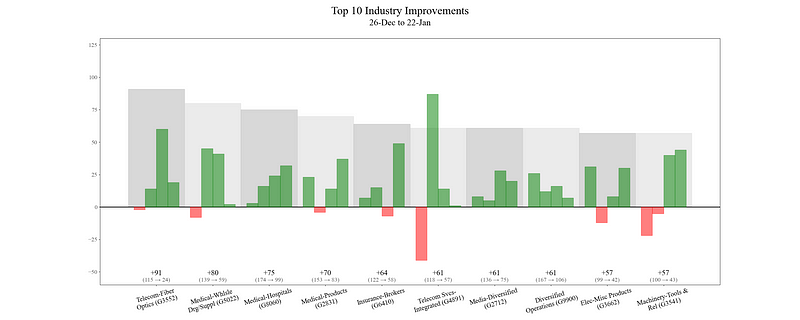
Another way to go with the flow of the market would be to select and diversify by sector. It’s been found that a stock’s price is greatly affected by the overall movement of its sector, but this correlation is completely unaccounted for by my strategy. (At a glance, it’s easy to tell how a sector is performing, so on some days I’ve made a specific effort to go long on retail or short on crypto mining, for example.) But some consideration should be made regarding sector rankings like those provided by investors.com or Zacks. This would enable me to trade not just any stock with a clear and current trend, but only a stock whose industry confirms the trend.
Conclusion
It’s been a long journey since I backtested my first trading algorithm, so I’m happy to be able to take the time today to reveal what has finally worked. This strategy probably won’t last forever (as very few market-beating strategies do), but since I’ve been profiting for a couple months I believe I can call it a success for now. I’ll be moving onto deeper analysis and a more complex diversification method to improve upon what I have.
Open to any feedback or questions about my analysis and implementation. Thank you for following along!


