
Learning Android
Learn Jetpack Compose Canvas Cubic and Quadratic Bezier And Its Usage
Thoroughly Understand Cubic and Quadratic Bezier and Its Usage in Jetpack Compose

I just shared about drawing arcs in Jetpack Compose Canvas Path Drawing. However, it is only useful for something that is having a perfect circular curve (like a circle or oval).
What if we want to have something that can have a slight curve or more, and is not fixed to a perfect circular curve, like plotting a graph
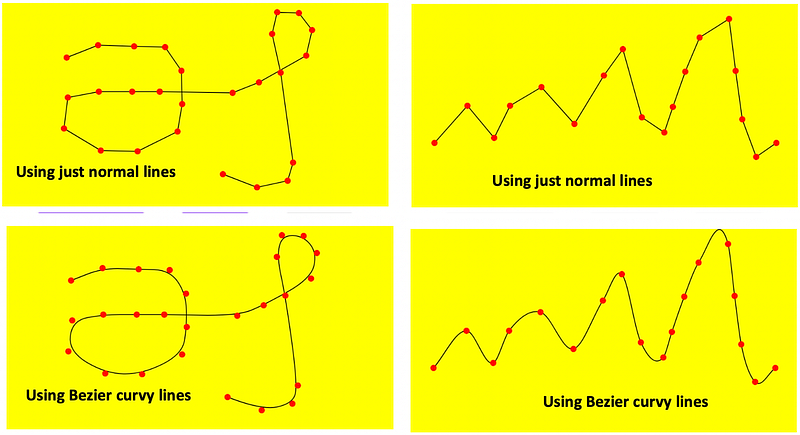
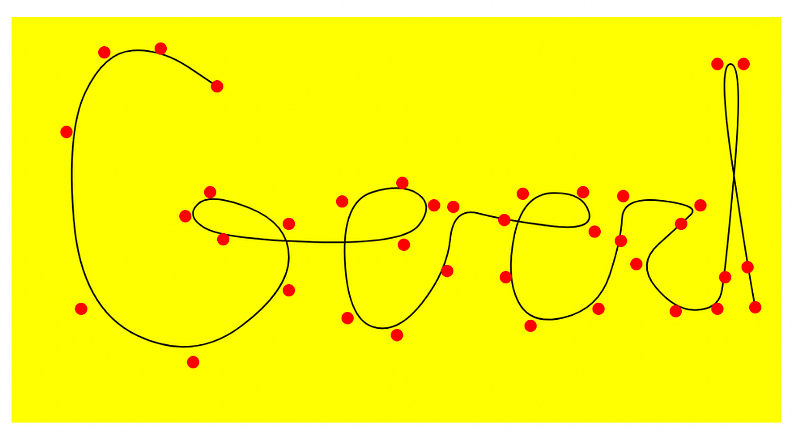
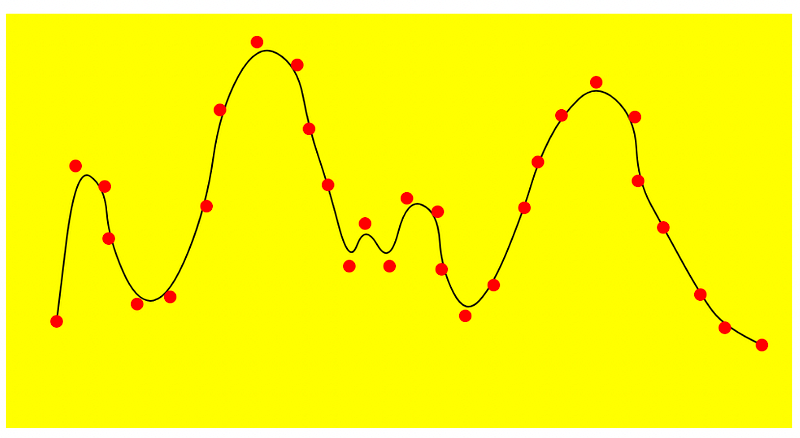
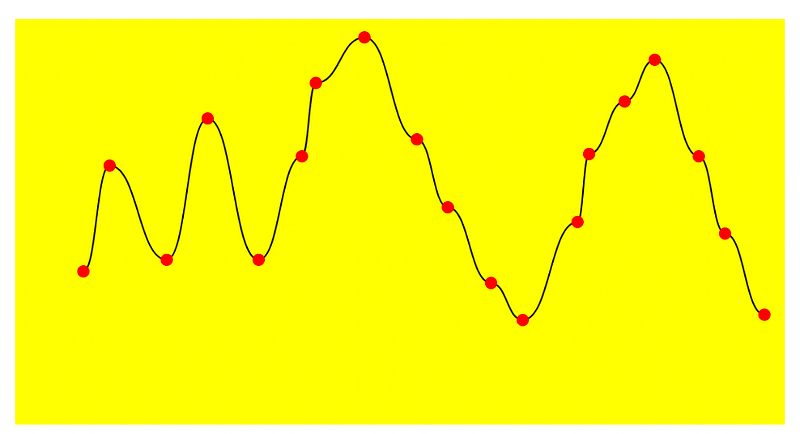
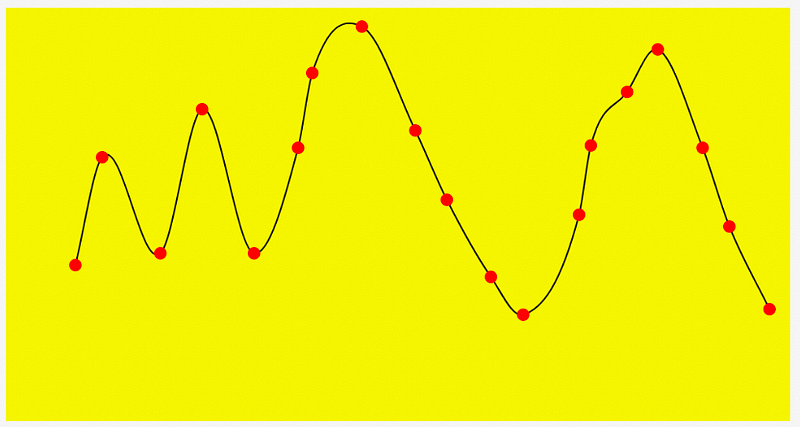
Or even drawing a well-connected curvy line given relatively scattered points as shown below
If you are wondering why can’t we just use lines to achieve this, look at the below, aesthetically, lines are not good for these.
So, here I’m going to illustrate how Bezier Curvy lines API works, for both the Jetpack Compose Canvas Path provided.
fun quadraticBezierTo(x1: Float, y1: Float, x2: Float, y2: Float)fun cubicTo(x1: Float, y1: Float, x2: Float, y2: Float, x3: Float, y3: Float)The maths of it
Just some basic understanding… helps us know math class in school is useful sometimes. 😛
Quadratic Bezier
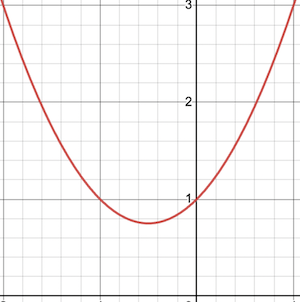
This is actually plotting a graph of ax² + bx + c = 0.
From school, if we remember this is a polynomial graph of something like below. You’ll notice there’s a curve of any 2 given linear points.
Cubic Bezier
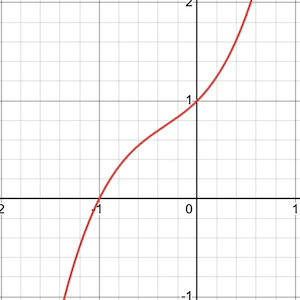
This is actually plotting a graph of ax³ + ax² + bx + c = 0.
This is plotting a graph as below. Differing from Quadratic Bezier, it can have 2 curves instead of one.
Plotting the Curve
To make learning more interesting, instead of explaining it, let me illustrate it using some animation as shown below.
Quadratic Bezier
Firstly, we notice the function has 2 points, x1, y1, and x2, y2.
fun quadraticBezierTo(x1: Float, y1: Float, x2: Float, y2: Float)To plot the Quadratic line, 3 points are required. The first point (Point1) though is from its previous path (lineTo, lineTo, etc), hence leaving 2 points (Point2 and Point3) to set.
So if I set the other 2 points through a linear interpolation (using the Lerp function. An excellent tutorial on Lerp can be found here.) change, whereby we
- Interpolate
Point1toPoint2;newPoint1 = lerp(point1, point2, t) - Interpolate
Point2toPoint3;newPoint2 = lerp(point2, point3, t) - Plot the points with the same interpolated scale in the drawn line above;
plotPoint = lern (newPoint1, newPoint2, t)
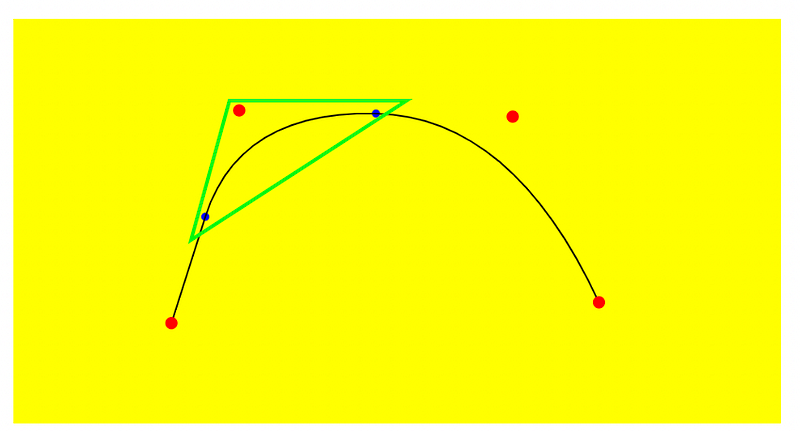
With this in place, now we can plot the curve as shown below. From here you clearly see how your Point1, Point2 and Point3 will determine how the curve is drawn.
Cubic Bezier
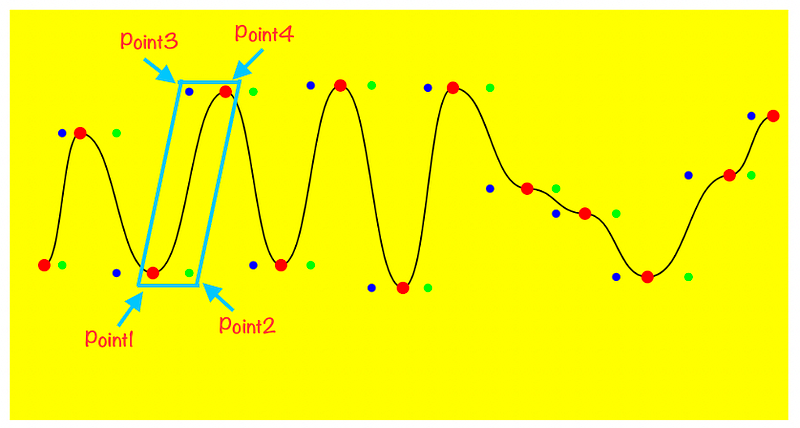
We notice the function has 3 points, x1, y1, x2, y2, and x3, y3.
fun cubicTo(x1: Float, y1: Float, x2: Float, y2: Float, x3: Float, y3: Float)To plot the Quadratic line, 4 points are required. The first point (Point1) though is from its previous path (lineTo, lineTo, etc), hence leaving 3points (Point2, Point3, and Point4) to set.
So if I set the other 3 points through a linear interpolation (using the Lerp function. An excellent tutorial on Lerp can be found here.) change, whereby we
- Interpolate
Point1toPoint2;newPoint1 = lerp(point1, point2, t) - Interpolate
Point2toPoint3;newPoint2 = lerp(point2, point3, t) - Interpolate
Point3toPoint4;newPoint3 = lerp(point3, point4, t) - At the same time, interpolate from
newPoint1andnewPoint2;interpolatePoint1 = lerp(newPoint1, newPoint2, t) - Also, interpolate from
newPoint2andnewPoint3simultaneously;interpolatePoint2 = lerp(newPoint1, newPoint2, t) - Plot the points with the same interpolated scale in the drawn line above;
plotPoint = lern (interpolatePoint1, interpolatePoint2, t)
With this in place, now we can plot the curve as shown below. From here you clearly see how your Point1, Point2, Point3, and Point3 will determine how the curve is drawn.
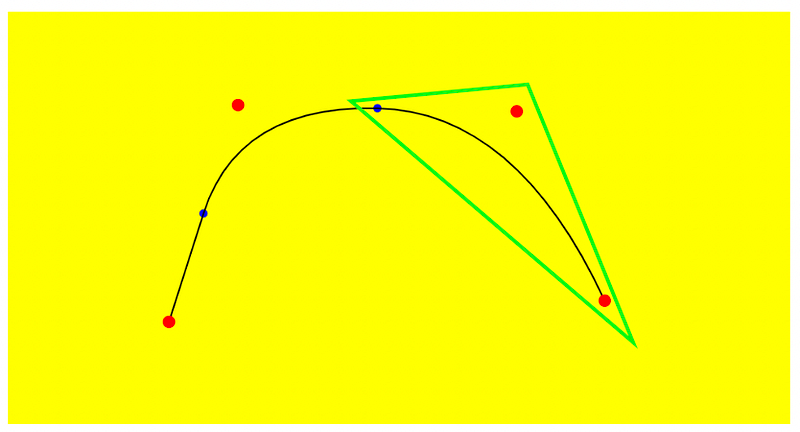
To make the plotting more interesting, let’s change the targetted starting point differently.
Application of Bezier
Just to. make learning fun, I’ll show a simple application of each Bezier below
Quadratic Bezier: Smoothen points drawing
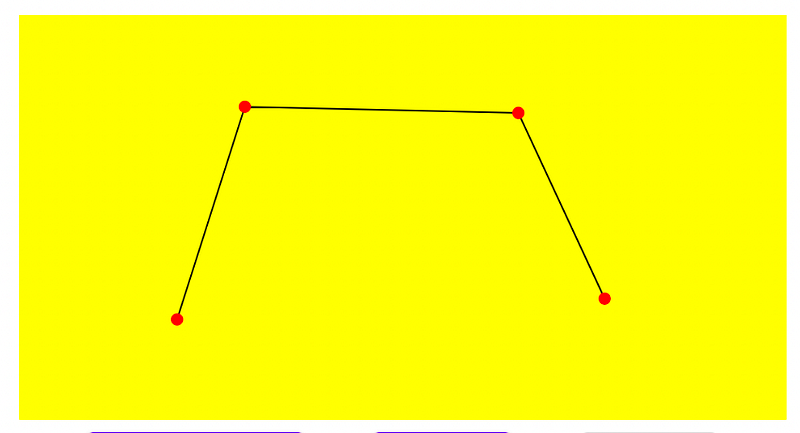
Assume I have 4 points below, using a line drawing, it will look really stiff.
However, if I plot using, where I use the average of previous and current points as the destination point (Point3), while the previous point is the supporting anchor for the curve (Point 2), given the Point1 is already fixed by the previous drawn point, it will curve the drawing.
path.quadraticBezierTo(
    previousX, previousY,
    (previousX + currentX)/2, (previousX + currentY)/x
)
Except for the last point, as I wanted to hit the final given red dot, so my last point will just use existing given points, instead of using an average.
path.quadraticBezierTo(
    previousX, previousY,
    currentX, currentY
)
While this looks like the plot line is quite a distance from the original dots (Red dots), if we have more plot points, it looks more decent as below.
It can also be used to plot a graph, as shown below
However, it has one clear disadvantage, that is in the event when the graph is up and down continuously, the plotted graph can get really disconnected from the actual point, as shown below.
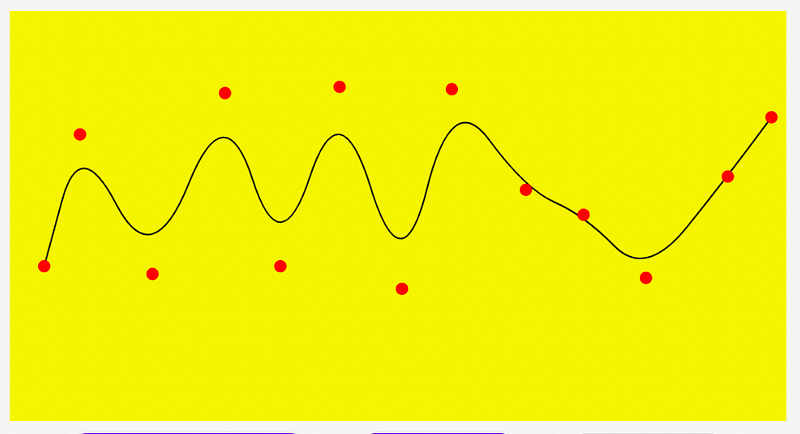
This is where Cubic Bezier will come in handy.
Cubic Bezier: Double curving the graph plotting
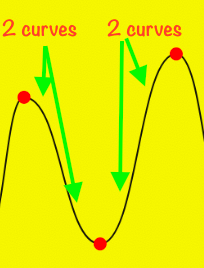
The problem with Quadratic Bezier is, it has only one curve.
In the event between 2 points, it needs two curves due to the up-down graph trend, the Quadratic Bezier will fail here.
But Cubic Bezier comes in handy, as it can have 2 curves between each point.
It can plot the previous graph much better as seen here.
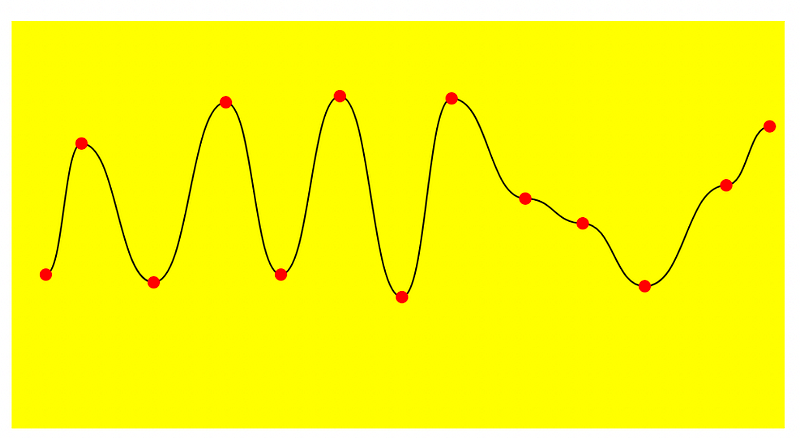
The formula drawn here is quite simple, whereby in between the 2 points, add the Cubic Bezier supporting points where
- Point2 = MiddleX, PreviousY
- Point3 = MiddleX, CurrentY
- Point4 = CrrentX, CurrentY
    path.cubicTo(
        (previousX + currentX) / 2, previousY,
        (previousX + currentX) / 2, currentY,
        currentX, currentY
    )
This formula is applied to all points of the graph (except for the first point of the path which is a MoveTo function).
Issues with graph plotting.
While this looks perfect, there is an issue with this generic formula.
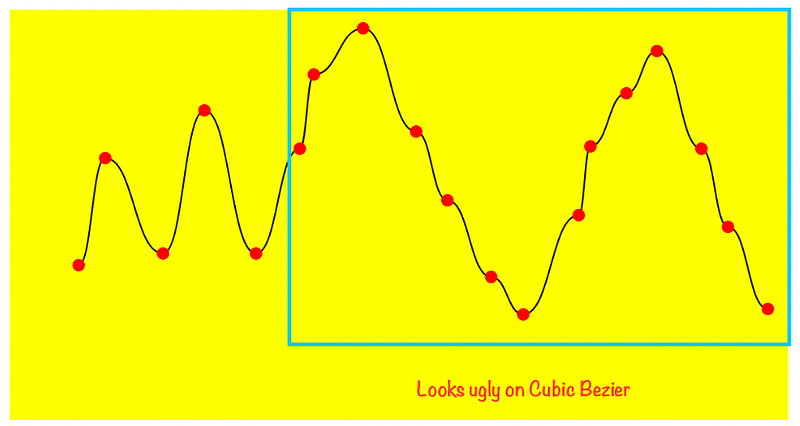
If we have not just an up-down graph, but also some relatively linear plot of a graph, the entire plot will look like below
You’ll notice the graph looks decent at the start but looks wrong subsequently
If we plot it with Quadratic Bezier, it looks like below
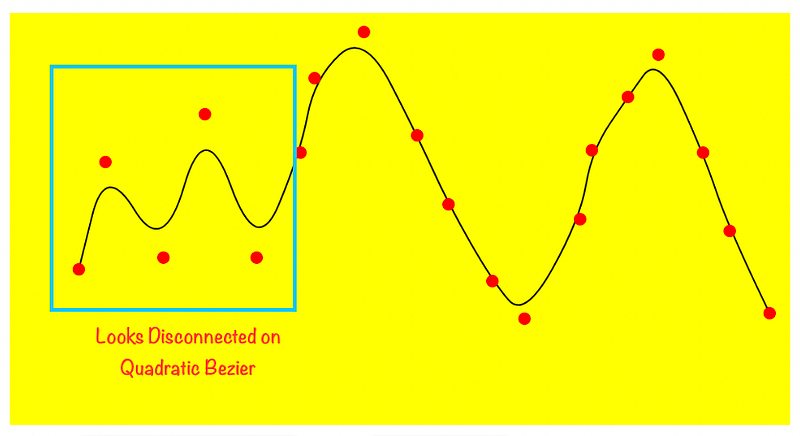
It is disconnected at the start.
How can we fix this? Can we have something better?
Yes, there’s more learning from me on how to plot a better graph, where the result is below. It is shared in this article below
P/S: For all the above, you can get the design here.. Enjoy playing with it.


