
Know Your Drugs: A Knowledge Graph for Drug-Drug-Disease Interactions
Build a shared database for drugmakers, FDA, doctors, and patients
Disclaimer: This article does not provide medical advice. It is intended for informational purposes only. It is not a substitute for professional medical advice, diagnosis, or treatment.
In today’s healthcare landscape, treating complex diseases often requires taking multiple medications concurrently, such as the cocktail therapies against HIV or COVID. Synergistic or additive drug combinations can increase efficacy, reduce toxicity, shorten duration, or prevent drug resistance (1). While this approach can be helpful in the fight against cancer or infections, other times it is a bad idea because of harmful drug-drug interactions. These interactions, when one medication influences the effectiveness or safety of another, can range from mild inconveniences to life-threatening risks.
Navigating this complex drug-drug interaction landscape demands a shared responsibility among all stakeholders: drug manufacturers, the Food and Drug Administration (FDA), doctors, and most importantly, patients. Firstly, manufacturers and the FDA play a crucial role in thoroughly evaluating and labeling medications for potential interactions. Accurate and comprehensive labeling empowers healthcare professionals and patients to make informed decisions. Secondly, doctors are gatekeepers, carefully considering the potential interactions before issuing prescriptions. A proactive approach, including reviewing patient medication histories and consulting drug interaction databases, is vital to minimize risks. Finally, patients need to be actively involved in safeguarding their own health, especially those under the care of multiple specialists who may be unaware of the other prescriptions (1). They should ask healthcare providers informed questions about drug-drug interactions and report adverse drug reactions to the authorities.
The key to shared responsibility is shared data accessible to all four parties, especially the drug-drug interaction knowledge data. Unfortunately, this data is both rare and difficult to access, sitting either behind paywalls or within data tables. As a result, it is hard to develop an open, easy-to-use knowledge portal for the public.
This article addresses this exact issue. It leverages drug-drug and drug-disease data from kaggle.com to construct a user-friendly knowledge graph. On the one hand, this graph allows users to efficiently query interactions for existing drugs. On the other hand, the pipeline predicts potential interactions by analyzing the interactions of their chemically similar counterparts within the knowledge graph. The code for this project is hosted on my GitHub repository.
1. Data and architecture
I merged two Kaggle.com datasets for this project: Indian Medicine Data (Apache 2.0), which details drug-drug interactions and side effects, and 11000 Medicine Details (CC0: Public Domain), which provided additional side effect information. In addition, I retrieved the may_treat, may_prevent, contraindicated_with_disease, has_mechanism_of_action, has_structural_class, and has_therapeutic_class relations from RXNORM in UMLS. You can read more about UMLS and its data retrieval process in my previous article, Getting Insights from 3,000+ Clinical Trials in a Knowledge Graph.
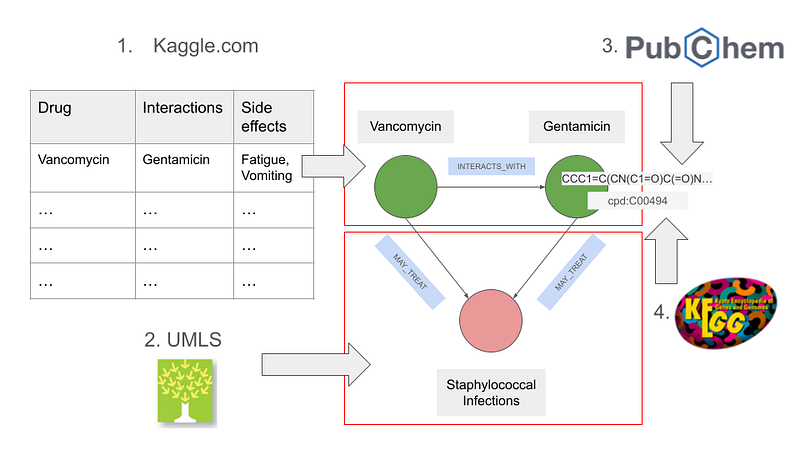
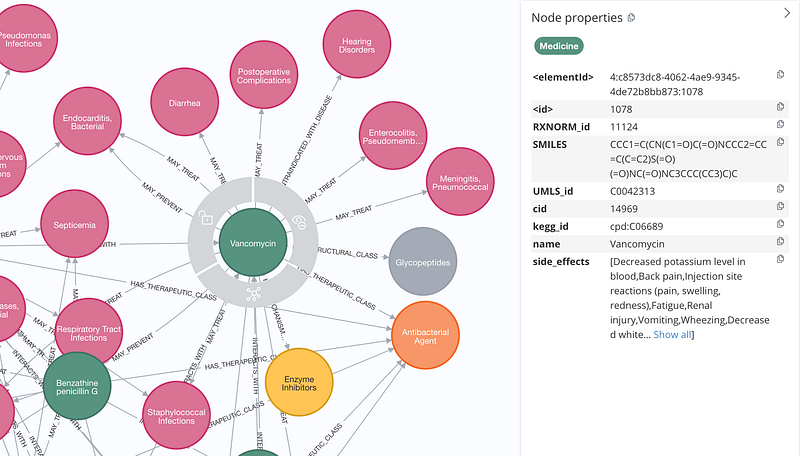
The drugs’ chemical structures in SMILES format were fetched via the REST API from PubChem. They can be used later as references in molecular similarity searches. Finally, I attached the KEGG IDs to the drugs (Figure 1) for the KEGG users. The data were sorted into nodes and relations. The former were formatted into JSON, while the latter were stored in the TSV format.
2. The knowledge graph
The JSON and TSV files were then imported into a Neo4j database. There are five types of nodes in the knowledge graph (Figure 2). Among them, the Medicine and the Condition nodes are the most important (Figures 2 & 3). This small graph contained 499 medicines, 869 conditions, and 1,395 drug-drug interactions.
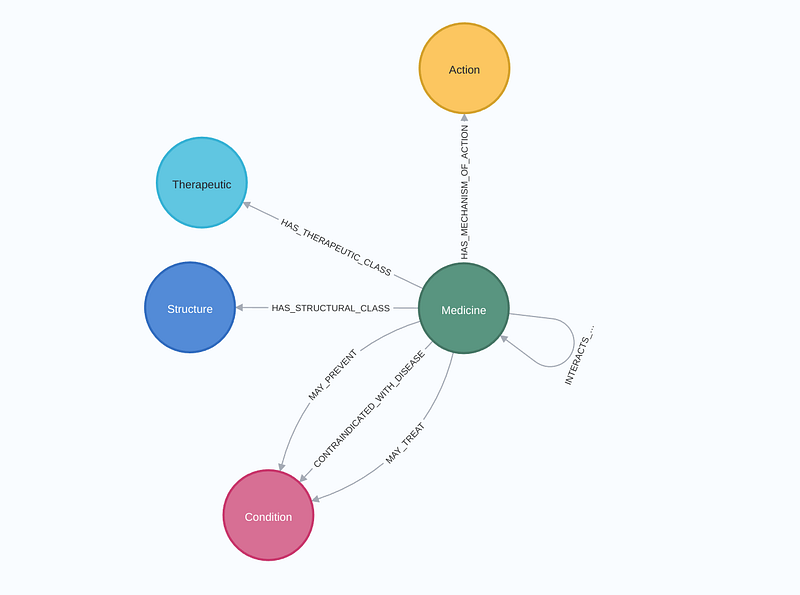
As Figures 2 and 3 show, there can be three types of relationships between Medicine and Condition: MAY_TREAT, MAY_PREVENT, and CONTRAINDICATED_WITH_DISEASE. Here, contraindication refers to a situation in which a medicine should not be used for a disease. For example, aspirin, a blood thinner, is generally contraindicated for those with bleeding disorders, as it can worsen the condition. Contraindications come in two categories: absolute and relative. Absolute contraindications represent a clear “no” due to high potential risks. For example, a severe penicillin allergy would be an absolute contraindication for taking any medication that contains penicillin. In contrast, relative contraindications require careful consideration, weighing the potential benefits against the risks involved. Interestingly, the knowledge graph may contain some hints about these two contraindications.
## Code 1
MATCH p=(m:Medicine)-[r:CONTRAINDICATED_WITH_DISEASE]->(c:Condition)
WHERE (m)-[:MAY_TREAT]->(c) OR (m)-[:MAY_PREVENT]->(c)
RETURN p
To identify potential relative contraindications, I searched for drugs that have either the MAY_TREAT or the MAY_PREVENT, and the CONTRAINDICATED_WITH_DISEASE relations with a particular disease.
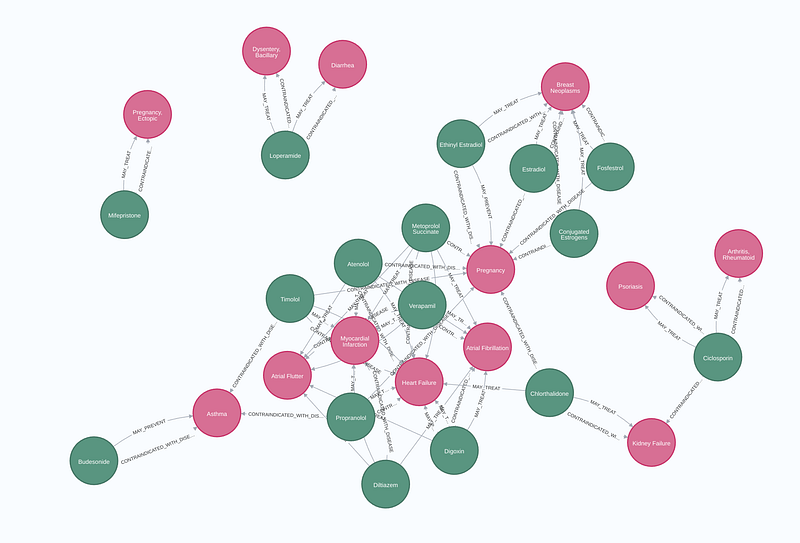
The graph returned 20 such pairs, such as Loperamide ➡️ Diarrhea (1) and Digoxin ➡️ Atrial Fibrillation (2). Atrial Fibrillation, myocardial infarction, heart failure, atrial flutter, and six other diseases form a cluster.
Next, I modified the query slightly to search for absolute contraindications.
## Code 2
MATCH p=(m:Medicine)-[r:CONTRAINDICATED_WITH_DISEASE]->(c)
WHERE NOT (m)-[:MAY_TREAT]->(c) AND NOT (m)-[:MAY_PREVENT]->(c)
RETURN p LIMIT 50
The idea behind this query is that if a disease only has a CONTRAINDICATED_WITH_DISEASE but no beneficial relationship with a drug, it is likely to be a case of absolute contraindication. The query yields pairs such as Glimepiride ➡️ Diabetic ketoacidosis, Warfarin ➡️ Hemorrhage, and 1,317 others.
Afterward, I asked for antagonistic drug pairs that treat the same disease but share some of the side effects.
## Code 3
MATCH  (m1:Medicine) -[:MAY_TREAT]->(c:Condition) <-[:MAY_TREAT]-(m2:Medicine) -[:INTERACTS_WITH]->(m1)
WHERE size(apoc.coll.intersection(m1.side_effects, m2.side_effects)) > 0
RETURN DISTINCT m1.name, m2.name, apoc.coll.intersection(m1.side_effects, m2.side_effects)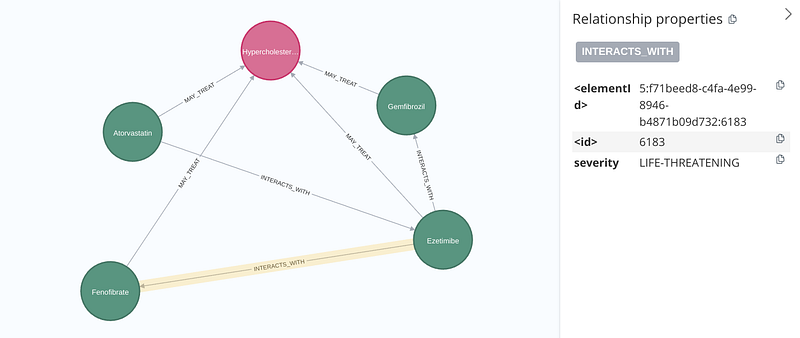
The query returned 36 pairs. For example, both Fenofibrate and Ezetimibe can be used to treat hypercholesterolemia. However, their combined use can be life-threatening (Figure 5) and they both cause diarrhea (Table 1).
3. Structural search and interaction suggestion
In addition to searching by name, users can also find drugs by using their SMILES structure. This approach allows us to identify structurally similar compounds when encountering a new drug or a generic drug. We can do this either locally or online. I began with creating a dummy SMILES structure based on the blood sugar-lowering drug Glimepiride and used it as my query.
## Code 4
dummy_SMILES = "CCC1=C(CN(C1=O)C(=O)NCC2=CC=C(C=C2)S(=O)(=O)NC(=O)NC3CC(CC3)C)C"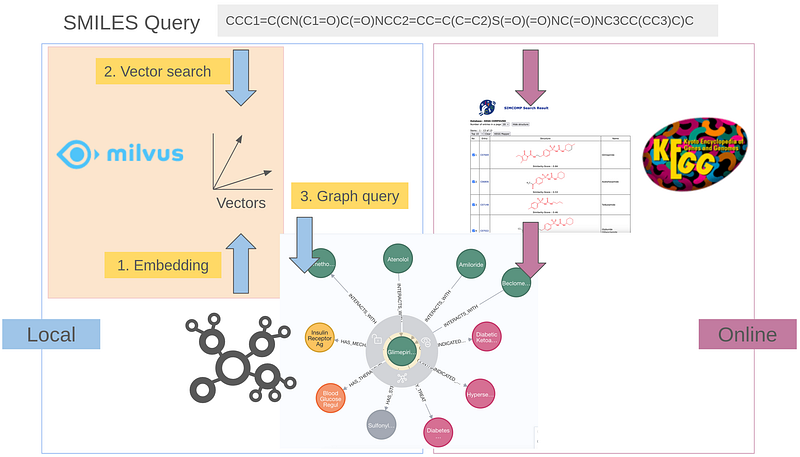
Afterward, I used the vector database Milvus locally. I have followed the official tutorial and crafted my own pipeline. It pulls the SMILES structures from the graph, converts them into vectors, and stores the results in a Milvus vector collection (Code 5).
## Code 5
driver = GraphDatabase.driver(PARAM["neo4j_url"], auth=(PARAM["neo4j_username"], PARAM["neo4j_password"]))

## pulls SMILES from the graph
content = "smiles,id\n"

with driver.session() as session:
    result = session.run('MATCH (m:Medicine) RETURN m.name, m.SMILES')
    for r in result:
        #print (r)
        if r["m.SMILES"] != "":
            content += r["m.SMILES"] + "," + r["m.name"] + "\n"

with open("SMILES_structures.csv", "w") as file:
    file.write(content)

...
## create a milvus' vector collection, not shown here
...

## converts them into vectors and
## stores them into the vector database collection
df = pd.read_csv('SMILES_structures.csv')

insert_pipe = (pipe.input('df')
                   .flat_map('df', ('smiles', 'id'), lambda df: df.values.tolist())
                   .map('smiles', 'fp', ops.molecular_fingerprinting.rdkit(algorithm='daylight'))
                   .map(('id', 'smiles', 'fp'), 'res', ops.ann_insert.milvus_client(host=MILVUS_HOST,
                                                                           port=MILVUS_PORT,
                                                                           collection_name='molecular_search'))
                   .map('smiles', 'smiless', lambda x: print(x))
                   .output('res')
)

insert_pipe(df)
The users can then compare the query SMILES against this collection.
search_pipe = (pipe.input('query_smiles')
                   .map('query_smiles', 'fp', ops.molecular_fingerprinting.rdkit(algorithm='daylight'))
                   .flat_map('fp', ('id', 'score', 'similar_smiles'), ops.ann_search.milvus_client(host=MILVUS_HOST,
                                                                  port=MILVUS_PORT,
                                                                  collection_name='molecular_search',
                                                                  param={"metric_type": "JACCARD", "nprobe": 10},
                                                                  output_fields=['smiles']))
                   .output('id', 'score', 'similar_smiles')
)

res = search_pipe(dummy_SMILES)
DataCollection(res).show()
The results are as follows.
As you can see in Table 2, the pipeline successfully identified Glimepiride as the closest match.
Alternatively, the user can compare the structure online. In that case, the user is querying the SMILES databases provided by the online vendors. So the results may contain structures outside our graph. There are some well-established utilities: fastsimilarity_2d from PubChem, Molport, or KEGG’s SIMCOMP. The following screenshot shows SIMCOMP’s results.
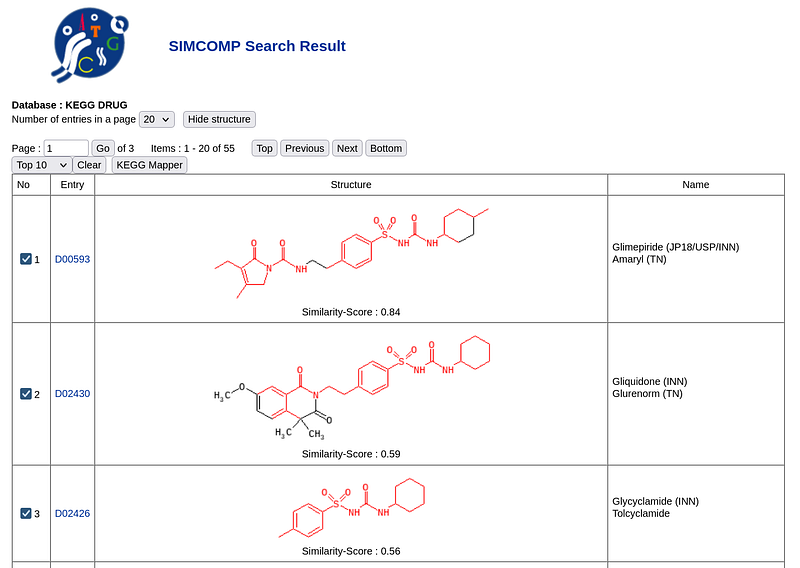
Figure 7 shows that SIMCOMP returned Glimepiride as the top hit, too. In fact, fastsimilarity_2d and Molport also agreed with the results.
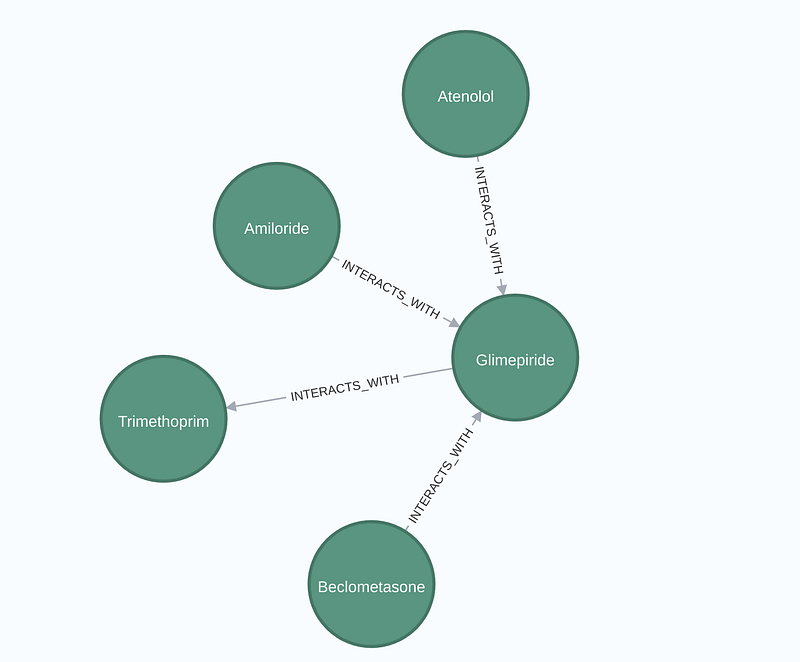
Once we obtain the hits, we can examine their drug-drug interactions. The idea is that drugs with similar structures may also have similar chemical properties and thus share similar drug-drug interactions. In our case, we found that Glimepiride interacts antagonistically with the following four drugs: Atenolol, Amiloride, Trimethoprim, and Beclometasone (Figure 8). We thus propose that the dummy drug may have the same interactions. To optimize testing efficiency, the manufacturer and FDA can prioritize evaluating the dummy drug against these four specific compounds before a broader analysis.
Conclusion
Even though she was targeting insecticides, Rachel Carson warned us about the dangers of chemical combinations in her 1962 book Silent spring:
A few years ago a team of Food and Drug Administration scientists discovered that when malathion and certain other organic phosphates are administered simultaneously a massive poisoning results — up to 50 times as severe as would be predicted on the basis of adding together the toxicities of the two. In other words, 1/100 of the lethal dose of each compound may be fatal when the two are combined.
This discovery led to the testing of other combinations. It is now known that many pairs of organic phosphate insecticides are highly dangerous, the toxicity being stepped up or “potentiated” through the combined action. Potentiation seems to take place when one compound destroys the liver enzyme responsible for detoxifying the other.
This text underscores the critical importance of pharmacovigilance — the science and practice of safeguarding medicine use through continuous monitoring and proactive risk mitigation. It requires the collaboration of drug manufacturers, regulatory bodies like the FDA, healthcare professionals, and most importantly, patients themselves. This project provides a vital component for this shared responsibility model: an easily accessible knowledge graph. This central hub empowers all four stakeholders to access and contribute valuable insights regarding drug-drug interactions. Consequently, the graph has the potential to transcend into a communication platform.
The graph is also a platform for scientific discoveries. We can perform data aggregation, graph algorithms, and machine learning to gain new insights. Although this article only demonstrated a structural search based on SMILES, I encourage you to integrate other structural formats such as MOL, SMARTS, InChI, and so on into the graph. Thanks to its semantic structure, it should be straightforward to integrate a GPT chatbot, too.


