
Kafka on Azure Kubernetes Service, Part 2
Calling it Part2, but this is indeed the third post in our series of running Kafka on AKS, or any flavor of Kubernetes:
- Blog Post One— Running Kafka on Kubernetes
- Blog Post Two— Monitoring Kafka via Prometheus & Grafana.
The rationale behind calling it Part 2 is that you would only need the context & concepts of the first one, where we deployed a basic Kafka Cluster on AKS, created some Topics & Users and test the setup with Producer & Consumer CLI commands. Building on those, this blog post would focus on:
- Exposing the brokers outside Kubernetes Cluster securely.
- Exposing Prometheus Metrics & Consuming them via Azure Monitor
Like before, we do most of our Kafka related setup using the Strimzi Operator for Kafka (version 0.19 at the time of this writing) and deploy Kafka to Azure Kubernetes Service, but you can deploy to any flavor of Kubernetes. Let’s get started !
Expose Kafka outside K8s Cluster Securely
As you tend to expose the Kafka brokers outside the cluster, you must do so securely & to that end you should consider:
- Enabling TLS encryption for data exchange
- Authentication to provide Identity
- Authorization to allow/decline actions to Users on Topics
All these features are supported by Strimzi Operator out of the box, and all we need to do is to add the following snippets in the Kafka Custom Resource. But before we go there, lets have a look at Listeners !
Listeners for Your Kafka Custom Resource
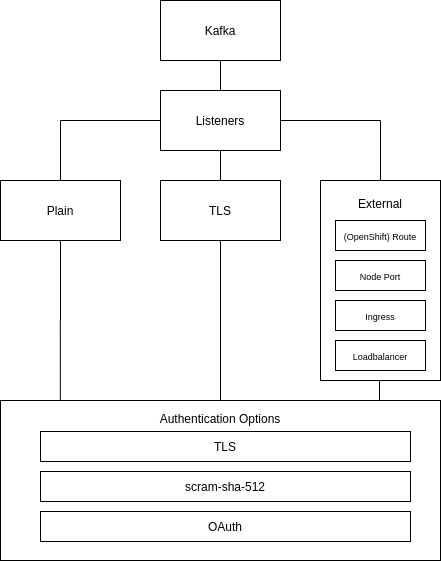
Strimzi introduces the concept of a Listener for a Kafka Custom resource, using which you can specify how the client applications would interact with Kafka brokers. It supports following variations
- plain — used to expose the brokers inside the cluster only. We used this in first blog of this series
- external — Use this to expose the brokers outside the cluster. Depending on how your Kubernetes cluster is setup, it supports different values for
externallisteners:loadbalancerfor using LoadBalancer services when using a public cloud service for Kubernetes,routeto use Openshift Routes,nodeportif you want to expose & use ports on Kubernetes nodes itself (like in a bare-metal environment),ingressto use Kubernetes Ingress like Nginx Ingress or Traefik. In this blog post, we will try & use theloadbalanceroption for our exposing our brokersexternally! - tls — Use this for having a mutual TLS Authentication within the Kubernetes cluster.
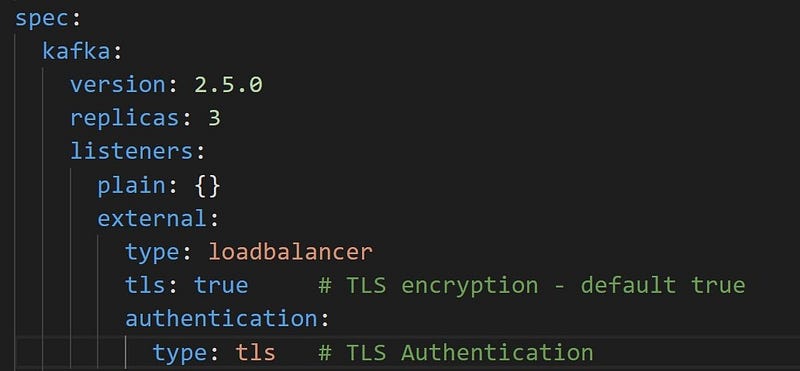
For our use case, we configure the external listener type with type: loadbalancer value as follows in our Kafka CR
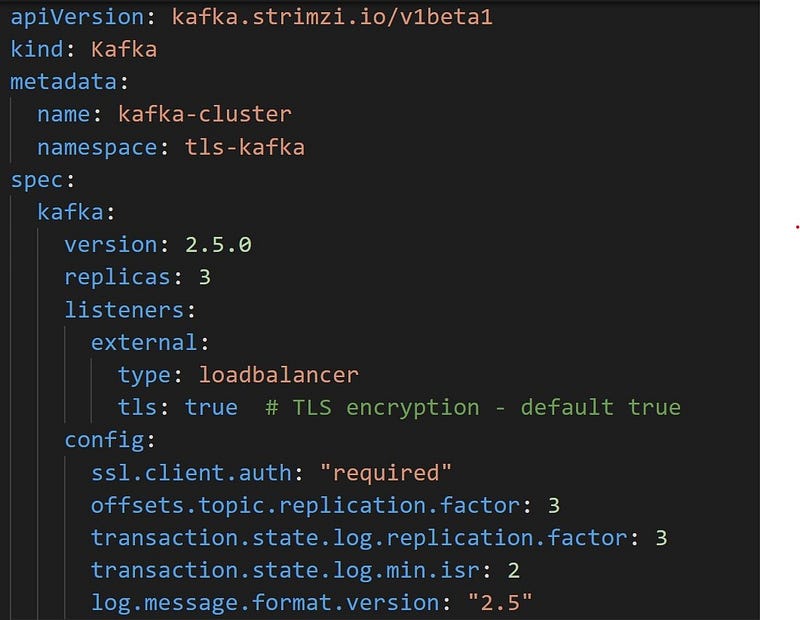
You can see the complete Kafka custom resource here. Let’s get started — Create a new namespace for your Kafka resources & create the Kafka cluster
kubectl create namespace tls-kafka
kubectl apply -f https://raw.githubusercontent.com/agrajm/strimzi-kafka-aks/master/tls-setup-public-broker-ep/kafka-cluster.yaml
What this does to our AKS Cluster is that it creates
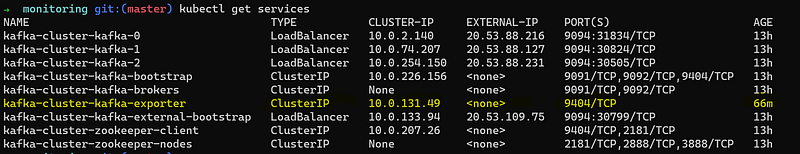
StatefulSets&Podsfor Kafka Brokers & ZookeeperConfigMapsto hold Kafka & Zookeeper configuration: kafka-cluster-kafka-config & kafka-cluster-zookeeper-config respectively.Secretsto hold Cluster CA Certs to enable TLS encryption.Servicesof typeloadbalancerone for each broker and one moreloadbalancertypeservicefor an external bootstrap service used to connect from outside the cluster.Public IPsfor each of the brokers (3, one for each replica) are created and new front-end IP configurations are added to thekubernetesload balancer for our AKS cluster, essentially exposing the brokers outside the cluster. Let’s see the exposedservices
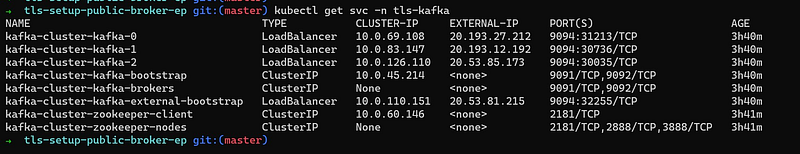
As you can see above, the Strimzi Cluster Operator also creates an external bootstrap service (in our case, its called kafka-cluster-kafka-external-bootstrap) which is used initially for bootstrapping but after that Kafka recommends connecting to brokers directly. The already existing kubernetes load balancer for your AKS cluster facilitates direct connectivity via multiple front-end public IP configurations. The target deployment architecture would be something on the lines of
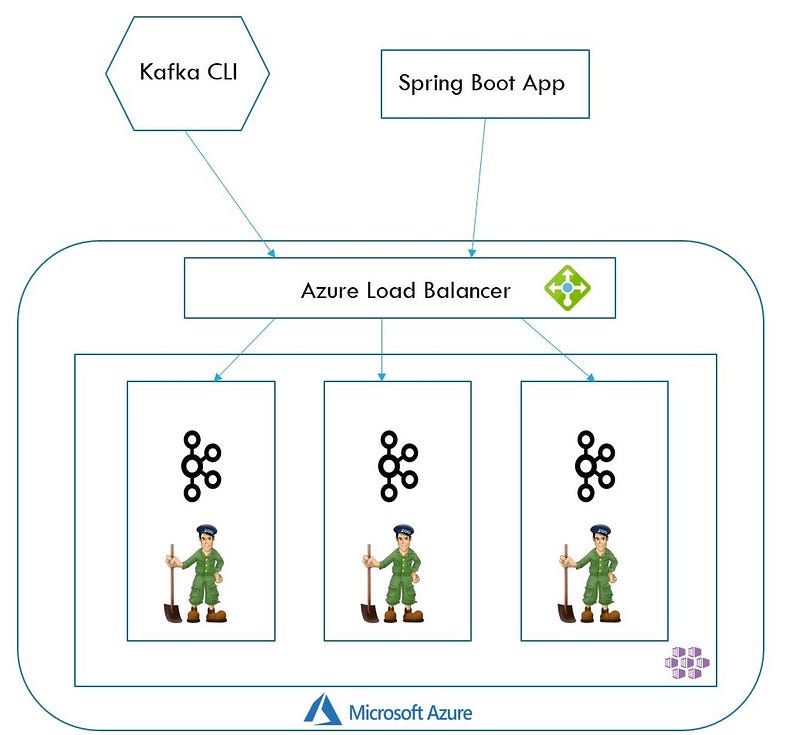
Note that in above image, the Load Balancer is not really an extra hop once the client applications know which broker to talk to. It is there to facilitate external communication from the AKS cluster and not really any load balancing.
You are also free to configure multiple listeners for the same Kafka cluster, if that is what you desire. For example you can expose the Kafka cluster running on Kubernetes without any security (No TLS encryption & No AuthN & AuthZ) to internal applications (which are running in the same cluster) assuming you trust them, while enforcing TLS encryption & Authentication & Authorization (as we will see below) to applications running outside the cluster using both plain & external listeners on the same Kafka Custom Resource.
Security
Let’s now drill down into each of the three 3 tenets of security:
- TLS Encryption for data exchange — This is enabled by default with
externallistener fortype: loadbalancerbut you can also setspec.kafka.listeners.external.tlsproperty totruemanually. - Authentication — Strimzi supports TLS Auth, SCRAM-SHA and OAuth for authenticating against the kafka brokers. This is achieved by configuring both
KafkaandKafkaUserCustom Resources as we saw in the first blog entry & we’ll see an example below. For our use-case we use TLS Auth and for that we set the propertyspec.kafka.listeners.external.authentication.typetotls
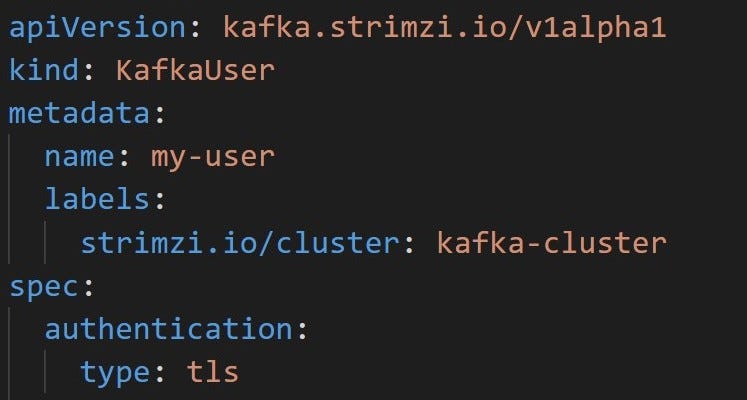
For the KafkaUser Custom Resource, we configure TLS Auth by setting the property spec.authentication.type to tls
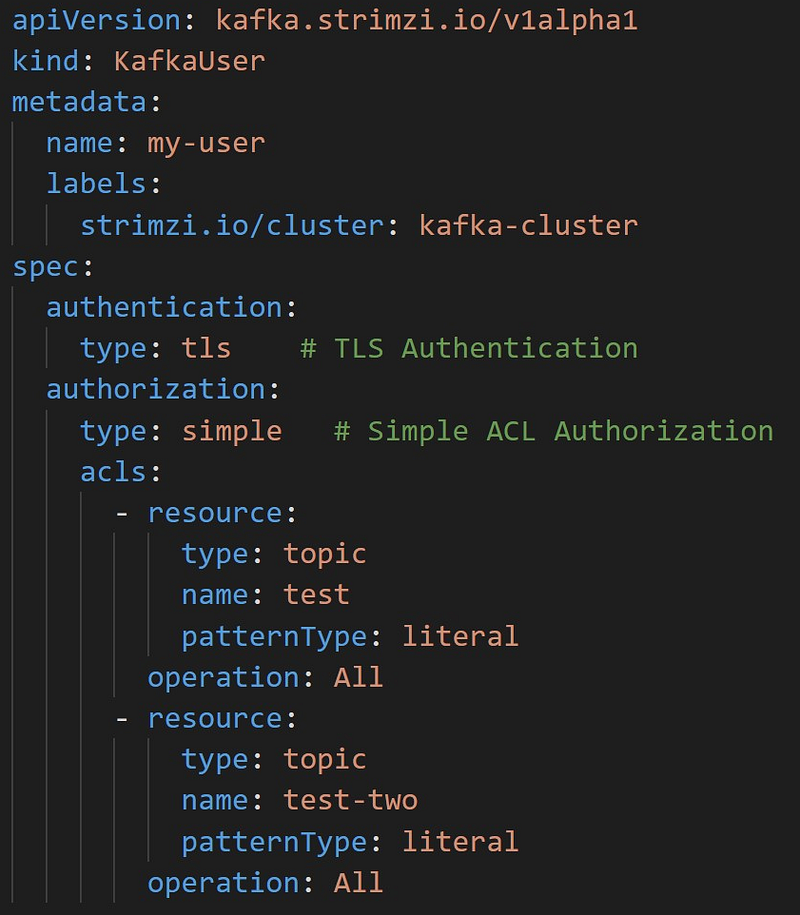
3. Authorization — Strimzi supports Simple ACL Authorization, OAuth2.0 based Authorization & Open Policy Agent(OPA) Authorization. Also for all these types, one can also define SuperUsers, who have complete access to all resources of the cluster. For this example we are using Simple ACL Authorization. This is configured in KafkaUser Custom Resource by setting the property spec.authorization.type to simple and defining appropriate ACLs for that user. In the example below, the user has full rights to topics test and test-two
As we saw in the first blog entry, both KafkaUser & KafkaTopic custom resources are tracked & managed by Entity Operator while any changes to Kafka is tracked & managed by Cluster Operator. Let’s proceed with creating some topics & users for our setup
# Topics: test & test-two
kubectl apply -f https://raw.githubusercontent.com/agrajm/strimzi-kafka-aks/master/tls-setup-public-broker-ep/kafka-topics.yaml
# User with TLS AuthN & Simple ACL AuthZ
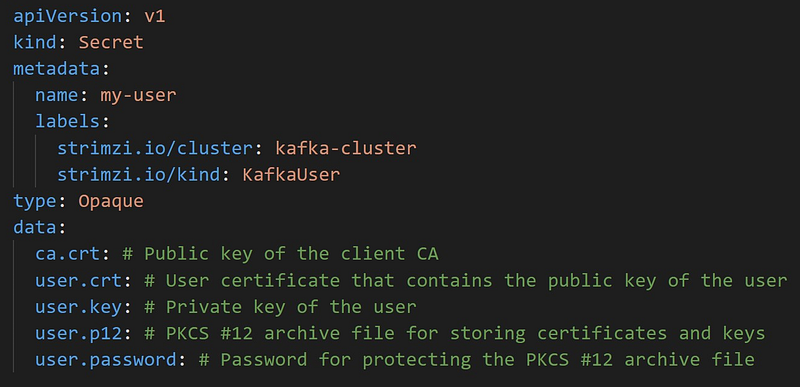
kubectl apply -f https://raw.githubusercontent.com/agrajm/strimzi-kafka-aks/master/tls-setup-public-broker-ep/kafka-users.yamlAs we apply these Custom Resources, the Entity Operator spring into action & create Topics & Users, but also creates Secret with the same name as that of KafkaUser — this secret contains a private and public key for TLS client authentication. The public key is contained in a user certificate, which is signed by the client Certificate Authority (CA). Let’s have a look
kubectl get secret my-user -n tls-kafka -o yamlThe my-user secret looks like
Mutual TLS Setup for Kafka
It’s a good idea to have a high level overview of how the 2 way mutual TLS authentication works for Kafka before start using these Secrets & Certificates to configure our TrustStore(s) & KeyStore(s).
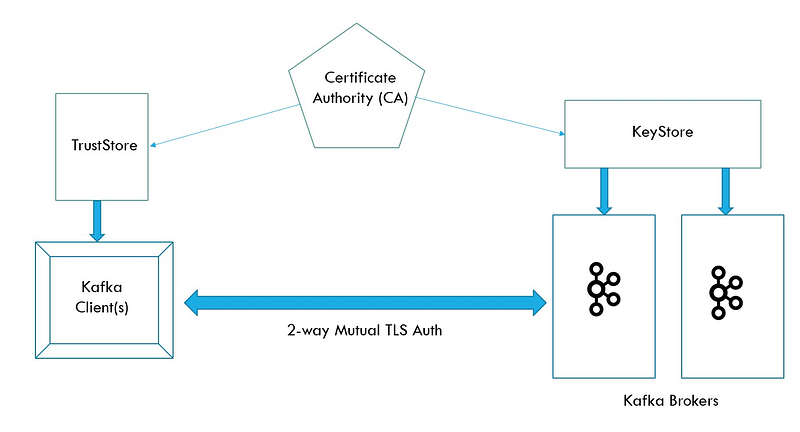
Since its a 2 way verification with Kafka Clients verifying the identity of Kafka Brokers and vice-versa — we need certificates! Certificates are signed by a Trusted Certificate Authority (CA) and issued to both Kafka Clients/Users and to Kafka Brokers, these certificates are used prove one’s identity. Creating the Certificate Authority and issuing & signing certificates is mostly automatic & taken care by the Strimzi Cluster & Entity Operators:
- When we create a TLS encryption enabled
Kafkacluster, the Cluster Operator creates a secret that holds the Cluster CA Certificate, which can be imported into the Client’s TrustStore to verify the identity of the Kafka Brokers. - Similarly, when we create a
KafkaUserfor this cluster with TLS Authentication enabled, the User Operator (part of Entity Operator) creates the secret which holds the private key & certificate for the Kafka Client/User, which can be presented to the broker to verify the identity of the client. - This 2 way verification occurs during the SSL Handshake that happens when a client tries to establish the connection with the broker.
We now only need to extract the certificates & keys from these Kubernetes Secrets and configure our truststores & keystores accordingly, as we’ll see in the next section.
And while we are at it, for those of us who have not configured SSL/TLS connections for a while, here is a quick one-line difference b/w a TrustStore and a KeyStore :
→ You use a TrustStore to store Trusted Certificates from, let’s say a Certificate Authority (CA).
→ You use a KeyStore to store your own private keys & certificates which can be presented to the other party to prove your identity.
Setting up Producers & Consumers
Now that we have the required infrastructure in place & with the above picture in mind, let’s configure the SSL/TLS setup:
- Import Cluster CA Cert into Kafka Client’s TrustStore — since we are testing with Kafka CLI tools so we need to import these into our JDK’s truststore using
keytoolcommand.
First we’ll extract & decode the ca.crt & ca.password from our Kubernetes Secret (kafka-cluster-cluster-ca-cert) containing the Cluster CA Cert into 2 files:
kubectl get secret kafka-cluster-cluster-ca-cert -o jsonpath='{.data.ca\.crt}' | base64 --decode > ca.crtkubectl get secret kafka-cluster-cluster-ca-cert -o jsonpath='{.data.ca\.password}' | base64 --decode > ca.passwordNow, we actually import these into our JDK’s truststore — which is typically the cacerts file in your Java installation. Run the following command to import the above certificate into cacerts
$ export KEY_PASSWORD=$(cat ca.password)
$ sudo keytool -importcert -alias strimzi-kafka-cluster-ca-cert -cacerts -file ca.crt -keypass $KEY_PASSWORD -storepass changeit
Using keytool we can import certificates into the default truststore cacerts and the above command uses the default password for the truststore: changeit but make sure to use your truststore specific settings here.
2. Import the Kafka User’s private key & certificate into Client’s KeyStore — so that when the Kafka Client initiates the SSL Handshake
Similar to the first step, we will first extract the keys & certificates from my-user kubernetes secret & decode them using base64
$ kubectl get secret my-user -o jsonpath='{.data.user\.crt}' | base64 --decode > user.crt
$ kubectl get secret my-user -o jsonpath='{.data.user\.key}' | base64 --decode > user.key
$ kubectl get secret my-user -o jsonpath='{.data.user\.p12}' | base64 --decode > user.p12
$ kubectl get secret my-user -o jsonpath='{.data.user\.password}' | base64 --decode > user.password
Now we have to create a keystore (kafka-client-auth.jks) using keytool
$ export USER_PASSWORD=$(cat user.password)
$ sudo keytool -importkeystore -deststorepass changeme -destkeystore kafka-client-auth.jks -srckeystore user.p12 -srcstorepass $USER_PASSWORD -srcstoretype PKCS12
Note that we have used changeme as the destination keystore password. We will use this in our SSL config file later on

3. Creating the SSL Config File
Finally we gather all the information in the SSL Config properties file that will be used with Kafka CLI producers & consumers
bootstrap.servers=<Public_IP_External_Bootstrap_Service>:9094
security.protocol=SSL
ssl.truststore.location=<LOCATION_OF_YOUR_CACERTS>
ssl.truststore.password=changeit
ssl.keystore.location=kafka-client-auth.jks
ssl.keystore.password=changeme
ssl.key.password=dwCx9dSCvstS
Finally fire up your Producers & Consumers and use this file as config
Kafka CLI Producer
$KAFKA_HOME/bin/kafka-console-producer.sh --broker-list 20.53.81.215:9094 --topic test --producer.config client-ssl.propertiesKafka CLI Consumer
$KAFKA_HOME/bin/kafka-console-consumer.sh --bootstrap-server 20.53.81.215:9094 --topic test --consumer.config client-ssl.properties --from-beginningAnd this is it ! We are able to connect successfully and perform SSL Authentication & TLS encryption with the Kafka brokers.
Azure Monitor for Monitoring Kafka
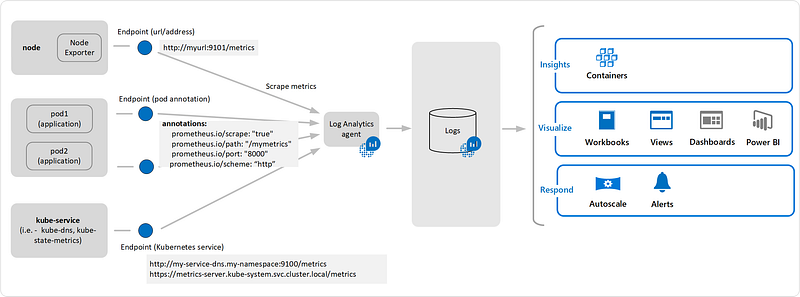
In this section, we will explore how we can setup Monitoring for our Kafka cluster running on AKS using Azure Monitor. As you might know, Azure Monitor Log Analytics agent is now capable to scraping Prometheus metrics from pods & nodes without having to install & manage Prometheus server & databases. The Log Analytics Agent is capable of capturing prometheus metrics from:
- Kubernetes Services like
kube-dns&kube-state-metricsor your own. - Any HTTP/HTTPS based URLs across your cluster.
- Any Pods or Metrics Exporters that you may be using — these will need to be annotated properly using
The config for Log Analytics Agent is typically configured in a global configmap — for your AKS Cluster this is not present by default. So you would need to download this ConfigMap template from Github & make changes accordingly (as we will see later in the post).
For Kafka Workloads, we also will make use of Kafka Exporter to provide with additional metrics for Brokers, Topics & Consumer Groups, offsets, consumer lag etc. Strimzi comes in handy here as well and provides an easy way to enable Kafka Exporter:
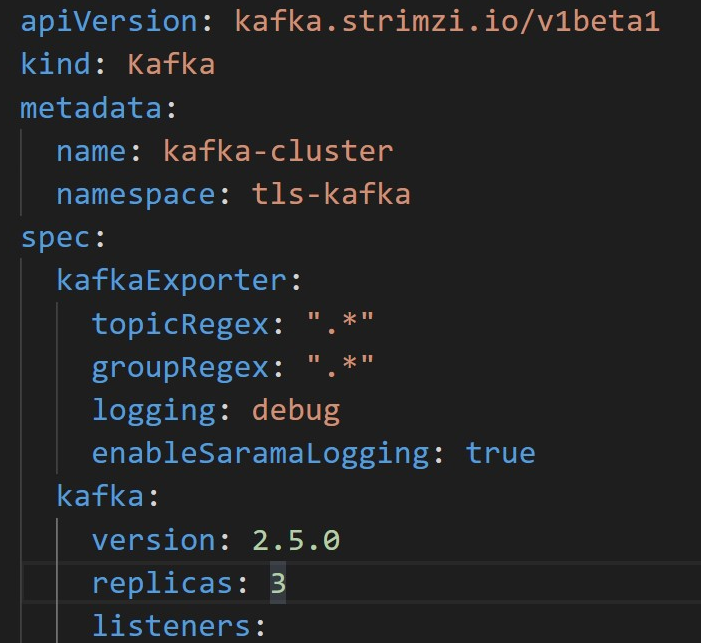
Above snippet shows how you can configure Kafka Exporter directly in your Kafka resource. Check the Strimzi docs for the schema for the exporter. Create a new Kafka cluster with metrics or modify your existing Kafka Cluster with metrics info.
kubectl apply -f https://raw.githubusercontent.com/agrajm/strimzi-kafka-aks/master/tls-setup-public-broker-ep/monitoring/kafka-cluster-metrics.yaml This creates an additional pod & service for Kafka Exporter.
You can see the raw Prometheus Metrics data by running the following command:
$ kubectl run debug-curl --rm -i --tty --restart=Never --image=radial/busyboxplus:curl -- curl "http://kafka-cluster-kafka-exporter.tls-kafka.svc.cluster.local:9404/metrics"Here we use a busybox pod & curl to the above Kafka Exporter Service’ metrics endpoint to see the raw Prometheus metrics.
We will now configure our Azure Monitor Configmap template (which we downloaded already) to scrap Prometheus metrics from this kafka-cluster-kafka-exporter service. Search for kubernetes_services in the configmap under the section [prometheus_data_collection_settings.cluster] and uncomment the service and specify your own Kafka Exporter service
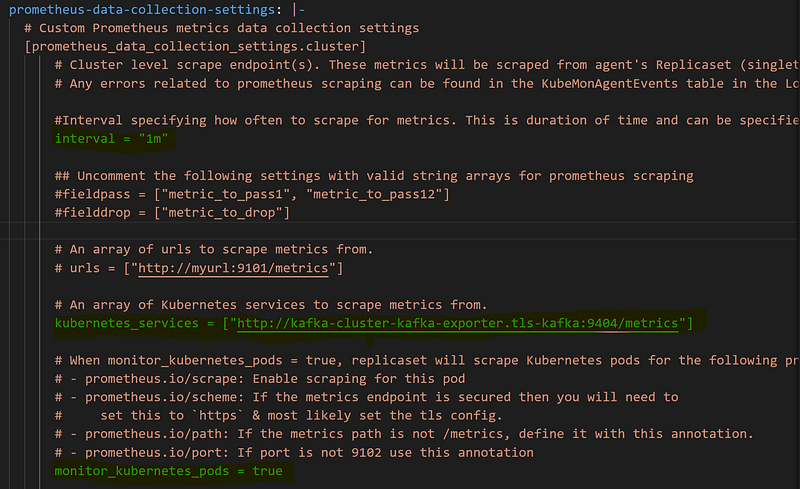
I have highlighted the important sections
- Although the default interval is 1m, you can configure this in
nanosecondsµsecondsif that is what you desire. - You can monitor individual pods instead of services but then you would need to annotate those pods with prometheus specific annotations.
- Importantly for our use-case we modified the
kubernetes_servicesarray to point to our Kafka Exporter services — note thetls-kafkanamespace after the service name. - The configmap also allows you to filter the metrics to pass through by specifying
fieldpass&fielddropin case you are concerned about the amount of logs & cost it can aggregate to. - Its worth mentioning again, this is a global Configmap — you only need 1 Configmap per AKS cluster so if this cluster is being shared by multiple teams, they would need to share this configmap as well.
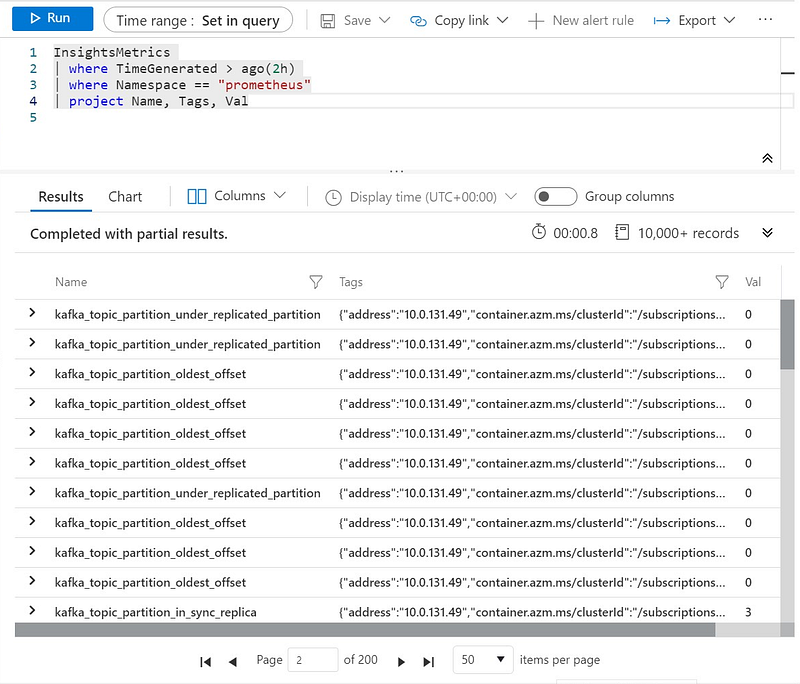
$ kubectl apply -f https://raw.githubusercontent.com/agrajm/strimzi-kafka-aks/master/tls-setup-public-broker-ep/monitoring/container-azm-ms-agentconfig.yaml That’s all you need to configure the Azure Monitor Log Analytics Agent / OMS Agent to scrape the prometheus metrics collected by the Kafka Exporter — these are now available in Log Analytics Workspace where you can query and create alerts based on these metrics. These metrics are available in InsightMetrics table and in prometheus namespace. You can use the following query to see the data collected in the last couple of
InsightsMetrics
| where TimeGenerated > ago(2h)
| where Namespace == "prometheus"
| project Name, Tags, Val
which shows us various metrics & their values.
It should be noted that Prometheus takes a flat approach to naming metrics instead of hierarchical, dot-separated notion, it uses a series of tags & labels on the metrics. For example to specify In-sync replica for a specific partition in a particular topic, Prometheus metric would be like
kafka_topic_partition_in_sync_replica{partition="3",topic="test"} 3This will be converted to Name & Tags in the InsightsMetrics table in Log Analytics. It will be stored as following:
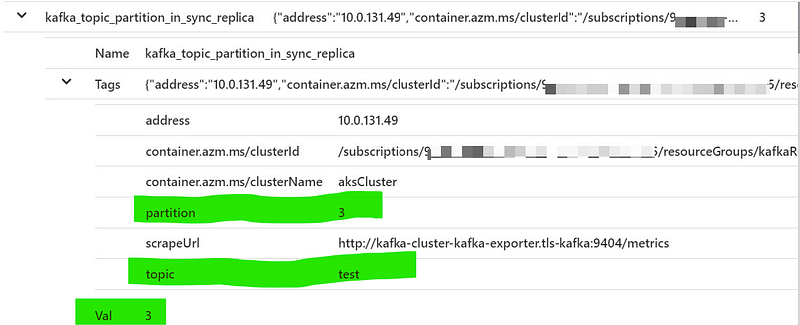
Therefore, you may need to tweak your queries accordingly.
Now that you have all the metrics in Log Analytics, you can use the standard features of Azure Monitor to create Alerts based on metrics & notify based on action groups.
This brings us to an end of a rather lengthy blog post, hope you enjoyed it and learned something new !