JavaScript Day 27 — Mastering JavaScript Basics: A Comprehensive Guide for Interview Preparation
100 Days of JavaScript Interview Prep: A Beginner’s Journey
Topic —Understanding JavaScript debugging tools
Get started debugging JavaScript
Debugging is the process of identifying and resolving errors or bugs within our code.
It involves inspecting the code’s behavior, finding the root cause(RCA) of unexpected behavior, and helping in corrections.
Step 1 — How to open Developer Console
Command Process
To open DevTools, right-click the webpage, and then select Inspect. Or, press Ctrl+Shift+I (Windows, Linux) or Command+Option+I (macOS). DevTools opens:
1. Press F12 or right click and press Inspect
or
2. You can also use Option + ⌘ + J (on macOS), or Shift + CTRL + J (on Windows/Linux
or
press Ctrl+Shift+I (Windows, Linux) or Command+Option+I (macOS). DevTools opens:
or
Manual Process
To open the developer console in Google Chrome,
- open the Chrome Menu in the upper-right-hand corner of the browser window
- select More Tools > Developer Tools.
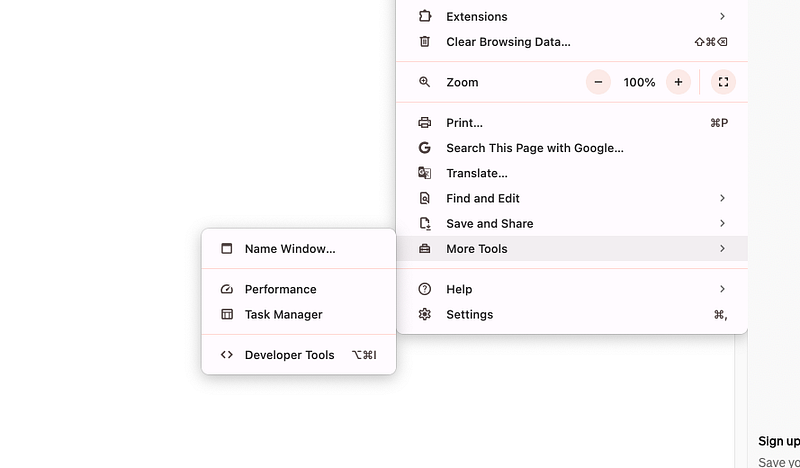
How to INTERACT WITH DEV TOOL and start your debugging journey.
Debugging is the most important skill of any programmer to identify the issue.
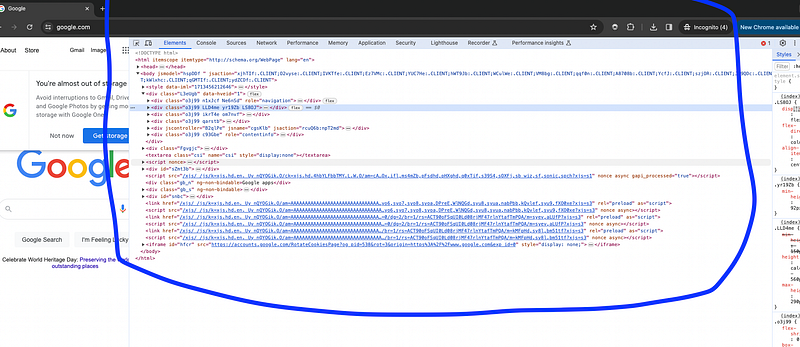
Chrome Dev tool is the most powerful tool for debugging the JavaScript.
STEP 2 — Dev Tool Panels
As per our above image attached — Dev tool will be available, and we can now explore below panel as per our requirement of debugging.
- DevTools opens the Elements panel and selects the element in the DOM tree. It will help to inspect the element in DOM and CSS
2. Dev Tools open the Console, Sources, Network, Performance, Memory, Application, Security, Lighthouse which help us to identify the activity of any web application for debugging various area’s.
3. Lighthouse — We can monitor performance and load by using lighthouse panel. Lighthouse is the most beautiful and amazing open-source automated tool for improving the quality of web-pages. It audits webpage for performance, accessibility, progressive web app and SEO and many more.
Note : I will cover lighthouse in another article.
4. Console Dev Tool panel —
As we covered in our previous article about console and its methods.
With help of Console we can use log variables, function calls, debug, error and warning method that might help us to understand the flow of our code and help in debugging the logs accordingly in various tools.
Let’s now understand how we can see console.log in our dev tool.
Step 1 — Open Dev tool
Step 2 — Navigate to Console Panel
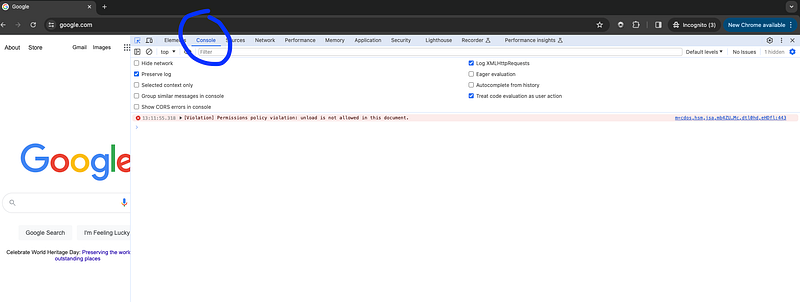
Step 3 — Viewing Console Message — Default view
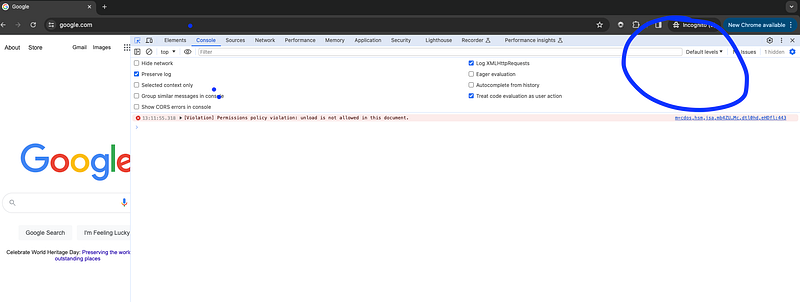
Step 4 — Logging Message to the Console window
Open any website and toggle on/off highlight —
You will notice of appearing and disappearing of console based on selection
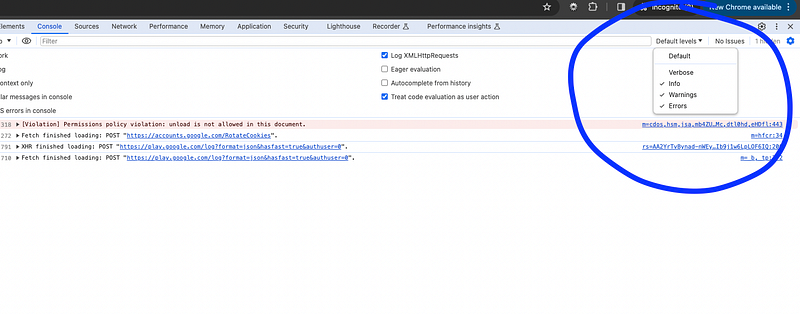
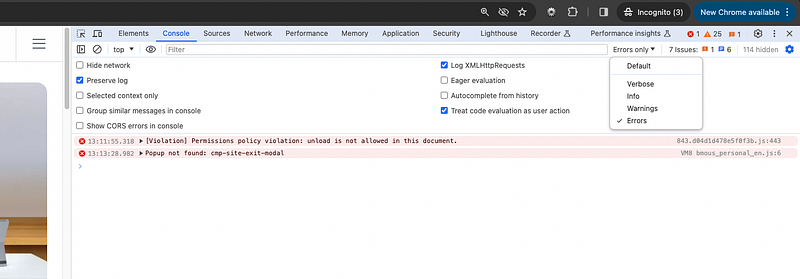
b) Error Console Logs Appearance
— always appear in Red
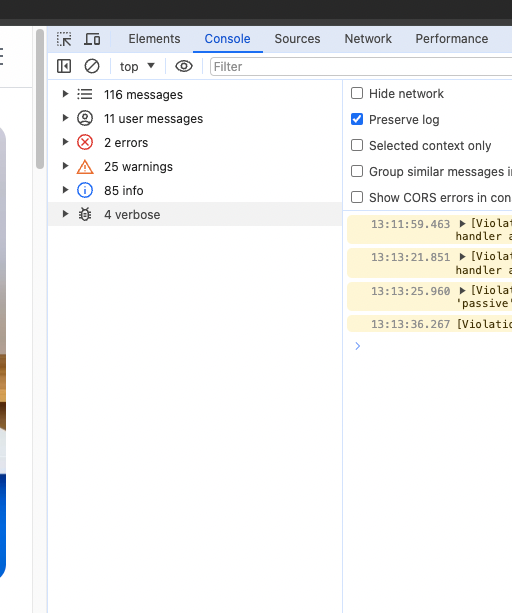
c) Side panel Console Panel window
- In the Side Console panel, We can GUI interface with all Methods
- Any messages logged to the console by the web page will also appear here.
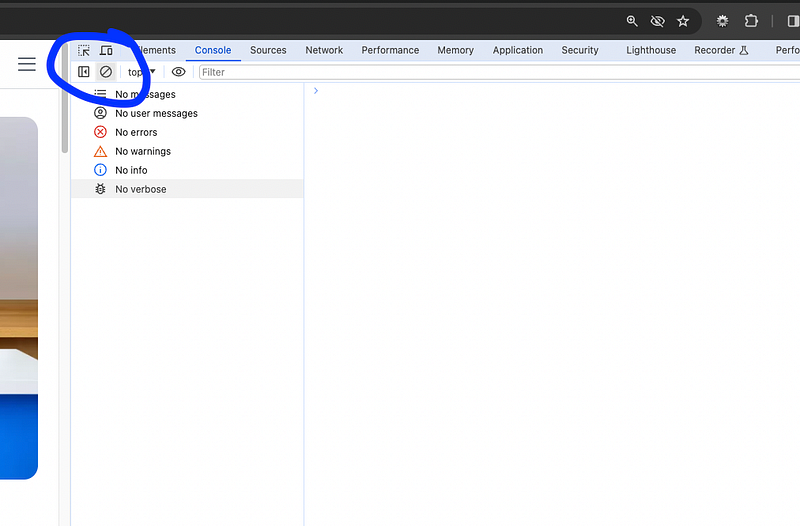
d) Clearing the Console
- If the console gets too cluttered, We can clear it by clicking the “Clear console” button (usually a circle with a line through it)
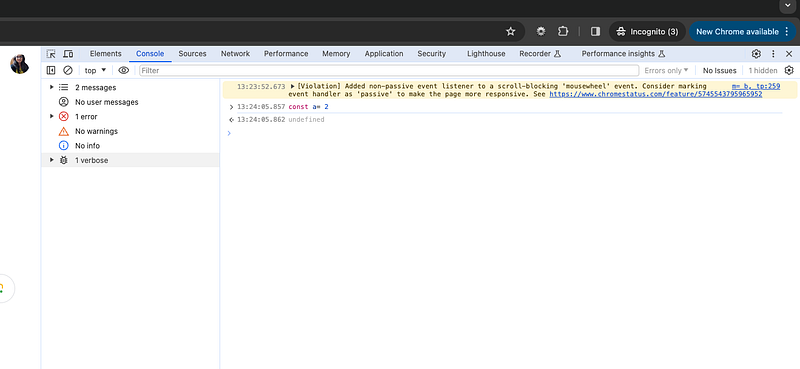
e) Executing JavaScript in the Console
- You can directly execute JavaScript code in the Console panel by typing it into the command line interface and pressing Enter.
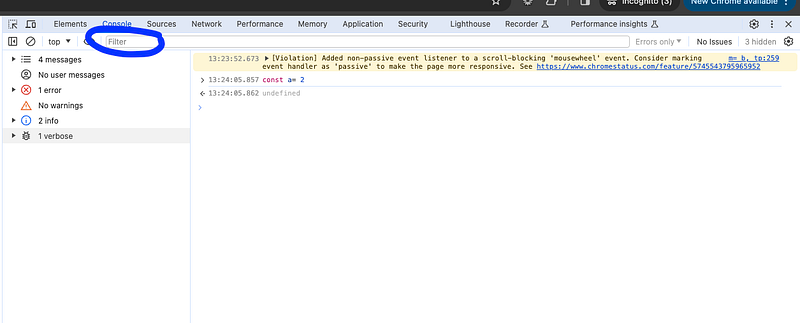
f). Filtering Messages
a) If there are too many messages in the console, you can filter them by clicking on the filter icon (usually a funnel-shaped icon)
b) Selecting the types of messages you want to see (e.g., Errors, Warnings, Logs).
Happy Coding and Stay Tuned :)
Kind is cool !!!
Share knowledge to gain knowledge !!!!
Be kind and treat people with respect !!
If you find my blog helpful, then please subscribe, claps and follow to support :)