
Java, Jupyter, and Plotly
Using a Java Wrapper for Plotly to create Visualizations for Google Colab Notebooks (Jupyter) running with a Java Kernel
Introduction
Jupyter and Plotly are not 2 packages you would typically associate with Java…
It’s also no secret that many of the most popular plotting libraries are not written in Java. That does not prevent us from leveraging existing tools like Plotly, though, and building wrappers for code written in other languages is not the faux pas some would have you think.
Tablesaw provides Java developers with one such solution:
With version 0.2.0 [Tablesaw] introduced a new plotting framework, which provides a Java wrapper around the Plot.ly open source JavaScript visualization library.
Plot.ly is based on the extraordinary D3 (Data-Driven Documents) framework, and is certainly among the best open-source visualization packages available in any language. Plot.ly is so good, it has become widely used in languages other than JavaScript such as Python and R, which already had solid options for visualization.
Prerequisites
As for Jupyter Notebooks and Java, I’ve covered this topic in more detail in previous articles:
Spencer Park, the developer behind IJava, has additionally mapped out a way for us to display our Tablesaw plots in Jupyter Notebooks.
Note: If you’re unfamiliar with using Java and Google Colab together, the two articles listed above will help get you started. For this article, I’m going to assume you have an .ipynb template with the Java Kernel configured, installed the kernel on your Google Colab host, and connected to a hosted runtime.
Getting Started
After installing the Java Kernel, we can load dependencies using Maven and IJava’s Magics. Let’s start by loading tablesaw-core and tablesaw-jsplot. Execute the following in a code block.
%%loadFromPOM
<dependency>
    <groupId>tech.tablesaw</groupId>
    <artifactId>tablesaw-core</artifactId>
    <version>0.41.0</version>
</dependency>
<dependency>
    <groupId>tech.tablesaw</groupId>
    <artifactId>tablesaw-jsplot</artifactId>
    <version>0.41.0</version>
</dependency>
Next, we’ll import many of the packages required to move forward:
import tech.tablesaw.api.*;
import tech.tablesaw.columns.*;
import tech.tablesaw.plotly.*;
import tech.tablesaw.plotly.api.*;
import tech.tablesaw.plotly.components.*;
import tech.tablesaw.plotly.traces.*;
Now, before we can begin our visualization tour de force, we need to wire Tablesaw’s JsPlot library to IJava & our Jupyter environment.
I might eventually try to dissect the above, and break it down in a future iteration of this article. For now, though, we’ll just move on to the plots themselves.
Plotting Examples
From this point onwards, plotting is pretty straightforward. Below, I’ve started with an example from Tablesaw’s collection.
A Simple Bubble Plot
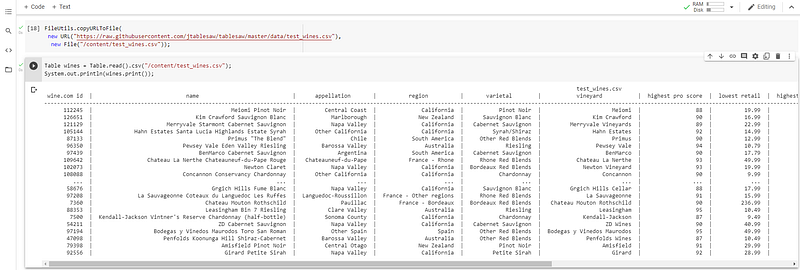
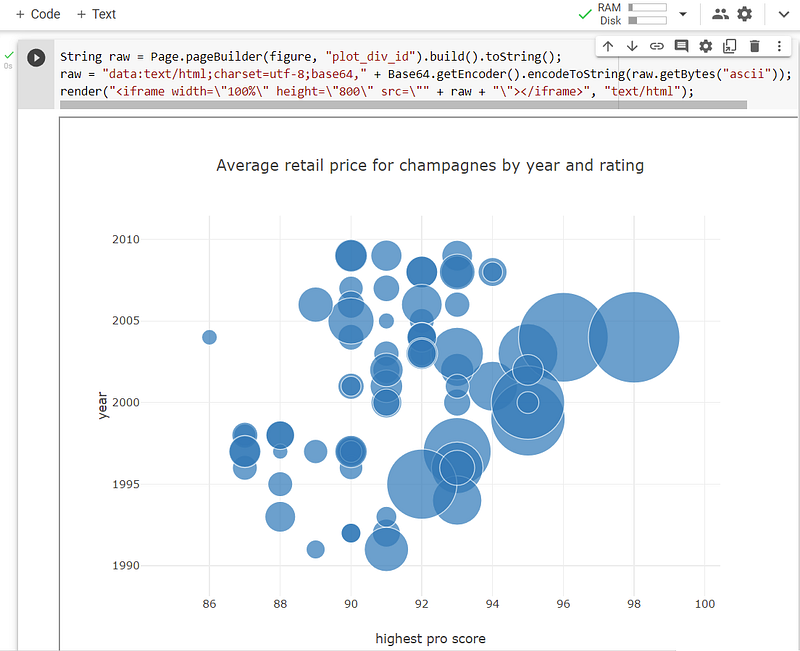
To start, we’ll use one of the examples provided by Tablesaw. Execute the following in a code block in your Google Colab notebook.
The bubble plot that appears is a relatively small plot with minimal flare.
Customize the Layout
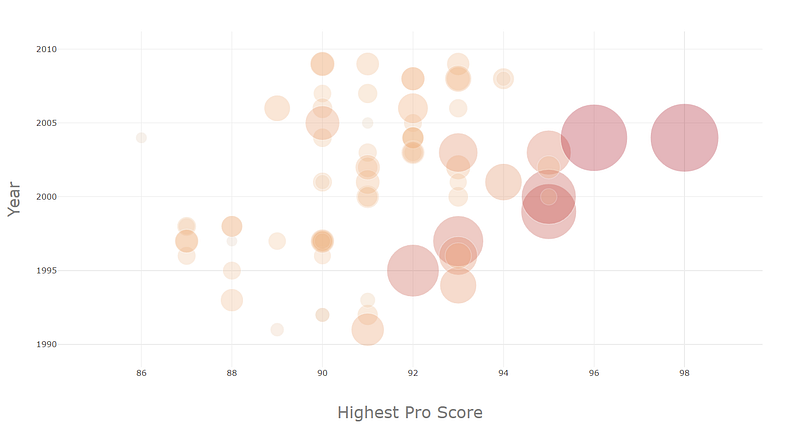
We can take this a step further and configure the Layout of the plot, rather than use the defaults provided by BubblePlot.create(...).
Here, we used both the Layout class, as well as an alternate constructor to modify:
- height & width of the rendered plot,
- font family, color, and size.
- color and opacity of our bubbles
Conclusion
This was intended to be a quick introduction to using Jupyter, Java & Tablesaw’s Plotly implementation. There are several more examples in Tablesaw’s GitHub Repository.
I’d love to hear back from anyone exploring how to use Java in the context of Notebooks (Jupyter, Zeppelin, etc.) and on the command line (JShell) for data processing and visualization using tools like Tablesaw. Shoot me a message, especially if you have published any material on Medium, and I’ll be happy to link to your content in the future, when relevant.


