

Automatically Predict all Missing Values by Gradient Boosting
If you’re in traditional machine learning, you are likely facing an ongoing battle with missing values (NaN) in your data.
This is the case in just about every Kaggle competition as well as in most of the tabular datasets out there.
Here I will go over all the viable approaches, provide the code in python and add a cherry on top at the end of this paper.
If you’re eager to jump into coding as you read, don’t. Finish reading first.
Having read this article you will have dealt with this problem once and for all.
Spoiler: in this article I will elaborate on the issue concisely, but if you just need a one-line solution:
$ pip install verstack
Problem statement
Missing values are the emty records (cells) in your csv/excel/dataframe. They can appear in different types of columns:
numeric
binary
- represented as numeric
- represented as strings
categorical
- represented as numeric
- represented as categoric
text
And there are different peculiarities in dealing with NaNs in each of these columns.
Common practice
Most practitioner Data Scientists will want to quickly get rid of the missing values and start fitting models to deliver the result.
Hence the quick solution is just to fill NaNs with certain constants for each type of the column with missing values:
numeric — mean/median of the column:
df[col].fillna(df[col].mean(), inplace = True)
binary/categoric (regardless of the data type in the column)
- most common category:
most_common_category = df[col].value_counts().index[0]
df[col].fillna(most_common_category, inplace = True)- introduce a new category
Regardless the simplicity — this approach is viable as missing data may appear due to a specific reason and making this ‘reason’ a new category may introduce a specific knowledge
new_category = -999 # this can also be a string
df[col].fillna(new_category, inplace = True)
text — constant string
df[col].fillna('Missing_data', inplace = True)
While all of these options are viable and widely used, the implications of this approach is adding bias to your data. Let me give you an example: Suppose you have a dataset with 3 rows and you’re missing one value in the airport_area column.
So the we know that NY airport has an area of 10 000 sq.miles, Atlanta airport: 9 000 sq.miles and the area for Milwaukee airport is missing. Using the column mean approach we would fill the NaN for Milwaukee area with 9 500 sq.miles almost equaling this small city’s airport to the ones on NY and Atlanta.
This way we have introduced a faulty information in our statistics and we will use this information as the ground truth when training our model. You get the idea…
Common practice deviations
Another solution is to drop rows with missing values. But you have to make sure you’re left with enough data to train on. A good benchmark would be at least 80% of your original data, subject to overall dataset size. E.g. if you have 1 000 000 rows in your original dataset with NaNs, then dropping 400K rows should not cause problems.
Dropping whole columns with NaNs is yet another option. This could be valid if a column consists of over 50–70 percent of missing values, otherwise you may be removing valuable information from your data.
Sometimes I have seen people placing zeros into the the missing values across the whole dataset…
Advanced practice
A much better approach to dealing with missing values is predicting them with machine learning. This is a much more accurate solution to the problem.
Let’s get back to our Milwaukee airport_area example:
Now instead of filling the missing airport_area for Milwaukee based on mean areas of NY and Atlanta areas, let’s have a look at other known characteristics. E.g. passengers daily transfer, number of exits, number of airstrips, etc. Having learned on the known airport_area examples and their corresponding characteristics a model can then predict the unknown airport_area based on the other charachteristics of this object.
So first you need to find out where are the missing values located in a particular column
col_nan_ix = df[df[col].isnull()].index
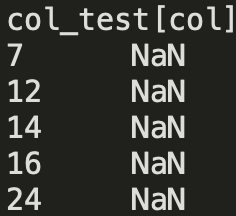
next you need to split your data into the training set (with known values for this column) and the prediction set (where we will need to predict missing values for this column); we will call them train/test for convenience, because this is nothing different than fitting a final model for your project
col_test = df[df.index.isin(col_nan_ix)]
col_train = df.drop(col_nan_ix, axis = 0)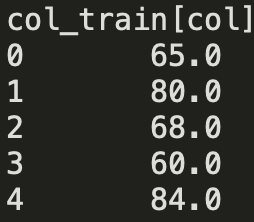
At this point you might be ready to fit your model. And depending on the model type you have selected, you might need to check for other missing values (in the independent features) in your col_train/col_test datasets.
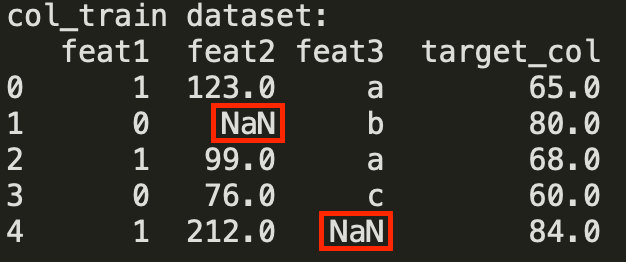
If this is the case, further train/test sets preparation in terms of NaNs in the independent features will depend on your model of choice to train on [feat1,feat2,feat3] and the target_col.
If you decide to use DecisionTreeRegressor or LinearRegression or basically any other model (which cannot train on data with NaNs) except for XGBoost/CatBoost — you will need to fill these NaNs as described above (Common practice). I have mentioned that this approach has it’s disadvantages, but as an intermediate step for filling NaNs in the created training subset’s independent features it is feasible, as long as your actual missing vaules that you will then replace by the predicted values will come from a model’s prediction.
Sometimes you would opt for a simpler model just because you might have hundreds of columns with missing values and hundreds of thousands of rows and fitting XGBoost models for each one of them may be costly. If you still want to use such a heavy model, you might want to consider reducing the size of your training data col_train for each training dataset created to predict a particualr column’s NaNs:
- limit the number of rows (10K or so should be enough)
- limit the number of independent features based on their corellation to the
target_col(10–20 features). All features must be numeric for measuring correlations
There is one more issue to deal with before we can fit any model: text in your data — that is a categorical column feat3 with values ['a','b','c']. Remember, all the data has to be numeric for a model to be able to train.
If you use an advanced model, such as XGB, RF, etc. — it is totaly okay to replace these values by integers (factorization). For linear models a better option would be one-hot-encoding.
Factorization example:
uniques = col_train['feat3'].dropna().unique().tolist()
mapping_dict = {key:val for val, key in enumerate(uniques)}
# now replace values in your col_train['feat3'].column
col_train['feat3'] = col_train['feat3'].map(mapping_dict)
Same has to be done to all the columns in your train/test subsets that are non numeric.
Note: it is better to create a copy of the original dataframe at the beginning and transform the whole thing before creating all the splits for each column and then transforming them separately.
# select, initialize model
from xgboost import XGBRegressor
model = XGBRegressor()
# fit on your training set for a particular column
model.fit(col_train.drop('target_col', axis = 1), col_train['target_col')# predict
pred_col = model.predict(col_test.drop('target_col', axis = 1))# place your predictions into the locations of the missing values in your full datasetdf[col][col_nan_ix] = pred_colNote: if your target column is represented as a categorical non numeric data type it will have to be transformed to numeric as I have shown above. But we can’t just replace it with random numbers! We have to remember how this column has been transformed so we can reverse transform it back to original values after training/prediction. In this case the created mapping_dict will come in handy: you will just have to reverse this dict before mapping it to the numerics to receive text. encoding_map = {val:key for key,val in encoding_map.items()}
This is basically the full pipeline for one column missing values imputation using xgboost.
This was a simple example, however with real data the named choices may not be that obvious. E.g. a categoric column represented as numeric: in this case you need to spot such columns, somehow understand that they are categoric and use that for further transformation/model configuration, etc.
If you want to impute NaNs using ML in hundreds of columns with missing values across your dataset — you will have make a lot of choices ranging from: how to transform which column, what to do with NaNs in the independent features, which model to select and how to configure it, etc. This can become tedious.
Impute all NaNs by ML with a single line of code
short answer:
$ pip install verstack
note: This article and the underlying code had been originally published in 2020, as of 2022 a new version of NaNImputer had been introduced wich is a current distribution of verstack.NaNImputer. The previous version had been overloaded with settings and performed much slower than the current version. The updated version has been simplified and improved without any compromise to the imputation quality. Since the previous version had been very popular, it has been saved within verstack under a new name NaNImputerLegacy. It includes lot’s of additional configuration options and in case you prefer it in your application, please refer to the documentation.
in python
from verstack import NaNImputer
imputer = NaNImputer()
df_withot_nans = imputer.impute(df_with_nans)
And that is it.
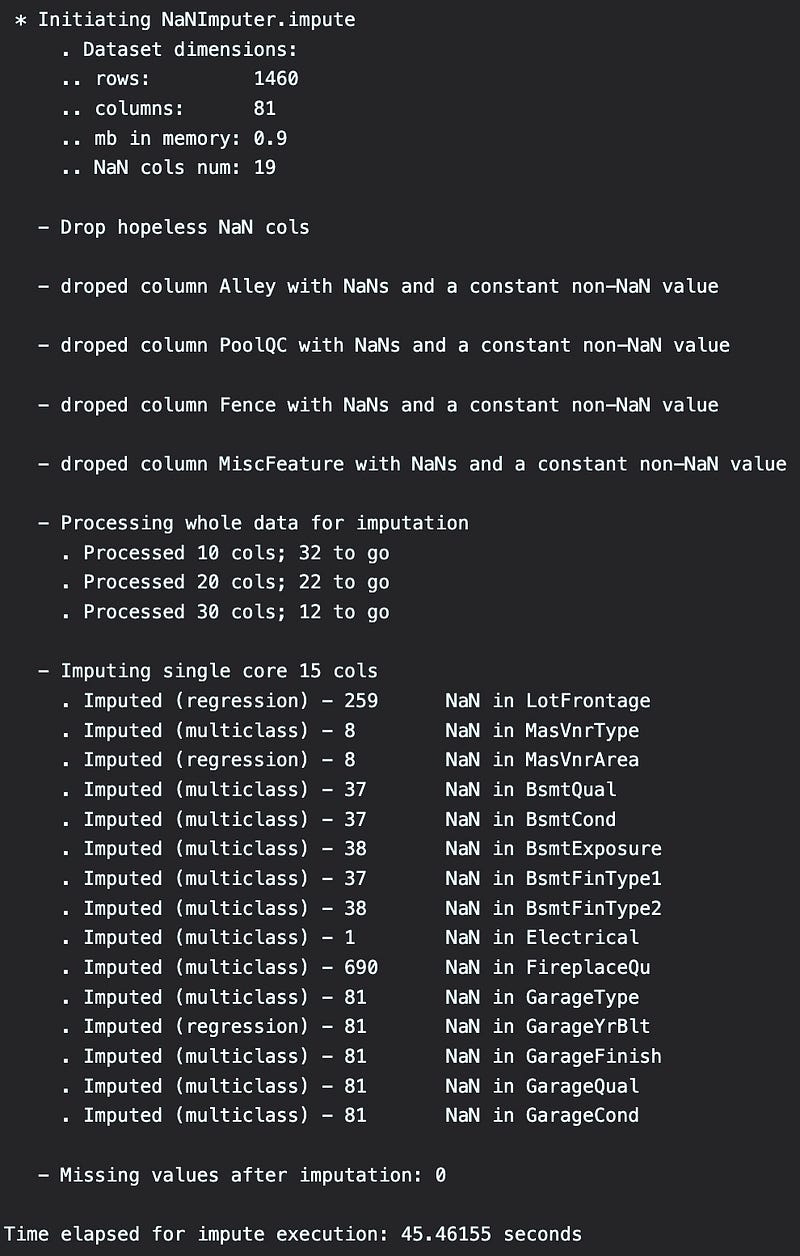
Let me give you an example on the house_prices_advanced_regression_techniques data set from kaggle
Below are the standard prints you are going to see on the imputation progress. Can be disabled by verbose = False
The picture really says it all…
The only two parameters you can configure are verbose and train_sample_size. The latter is set at 30000 by default which will truncate the training sample to 30K samples for training the imputation model for each column. 30K is a sufficient amount of data for a decent prediction and it significantly speeds up the process, especially for the larger datasets.
Additional package capabilities
verstack is an evolving open source project that is intended to provide useful machine learning tools.
The package includes solutions to some day-to-day tasks that didn’t have any convenient solutions before. Current modules:
verstack.PandasOptimizer— automatic memory optimization when reading data into pandas. One-liner for 5-fold memory footprint reduction & significant training time decrease Medium articleverstack.FeatureSelector— automated feature selection tool based on quick recursive feature elimination by various ML models Medium articleverstack.Multicore— parallelise any function with a single line of code Medium articleverstack.Stacker— automated ensembling factory; create multilayer stacking ensembles with a few lines of code Medium articleverstack.DateParser— ultimate DateParser class that automatically finds and parses datetime feats from all the possible datetime formats in you dataframe Medium articleverstack.LGBMTuner— full blown LGBM tuning with with a single line of code (withoptunaunder the hood) Medium article- categoric encoders
FactorizerOneHotEncodeFrequencyEncoderWeightOfEvidenceEncoderMeanTargetEncoderMedium article verstack.NaNImputer— impute all the NaN values by machine learning with a single line of code Medium articleverstack.ThreshTuner— automatic threshold selection for improving loss function Medium articlestratified_continuous_split— continuous data stratification (by far the most popular tool). Medium articletimer— convenient timer to measure any function execution
Feel free to check it out.
Links
NaNImputer documentation
verstack documentation