
ICML 2020. Comprehensive analysis of authors, organizations, and countries.
ICML is one of the most important conferences in Machine Learning and therefore it’s interesting to see who publishes at this conference. So I looked at the accepted papers for ICML 2020 and analyzed authors, organizations, and countries that participated this year. The conference will take place virtually from 13th to 18th July in 2020.
This year there are 1088 accepted papers from 4990 submissions, leading to 21.8% acceptance rate.
Before we dive in, the code can be found at GitHub repo and you can build your own plots in this Colab notebook (no installation required).
Authors
Let’s first take a look at the top authors.
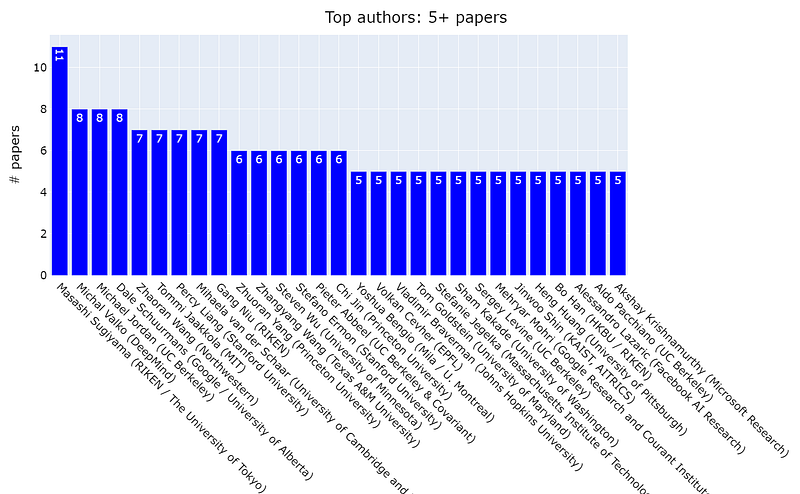
Publishing at ICML is incredibly hard and hence it’s even more impressive to see that so many authors published several papers. Masashi Sugiyama from RIKEN and the university of Tokyo has astonishing 11 accepted papers. He is followed by Michal Valko (DeepMind), Michael Jordan (UC Berkeley), and Dale Schuurmans (Google / U. of Alberta).
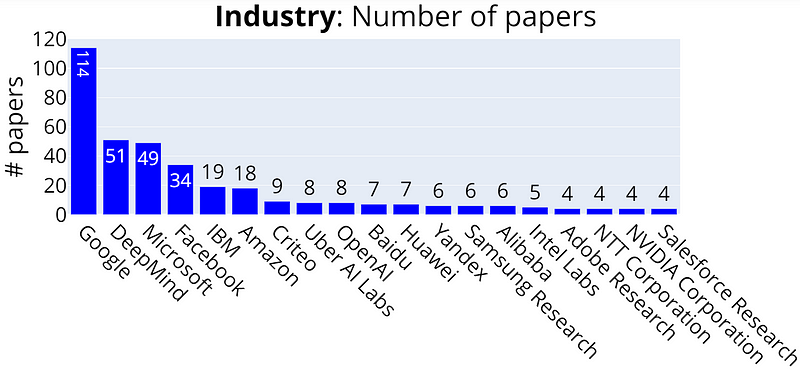
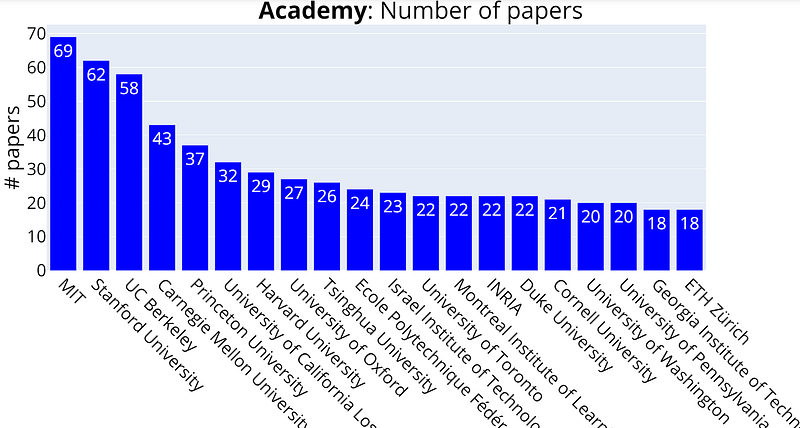
Let’s now look at global ranking by the organization. For each organization, I count the set of all papers it participated in. Here are top-30 organizations.
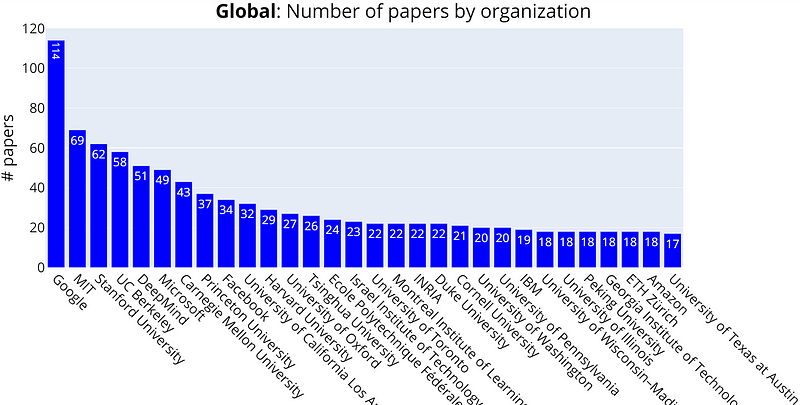
Google dominates the list, participating approximately in 1/10 of the papers published at ICML. It is followed by 3 institutions: MIT, Stanford, and Berkeley. Alphabet’s DeepMind concludes the Top-5 organizations. One note of caution that it’s not fair to say that Google+DeepMind published 114+51 papers as many of these papers were done in collaboration, as we will see next.
Countries
Here is a fun part. I created a mapping between an affiliation of the author and its country, so we can see which countries publish the most.
As a disclaimer, I must warn that creating a mapping for all possible affiliations is a nightmare (people abbreviate, make typos, and call the same institutions differently), so I did my best to get a decent mapping, which has countries for ~7K affiliations, but I think it’s not perfect, and if you see some missing mappings, feel free to edit the mapping file yourself.
Let’s take a look at the breakdown by countries.
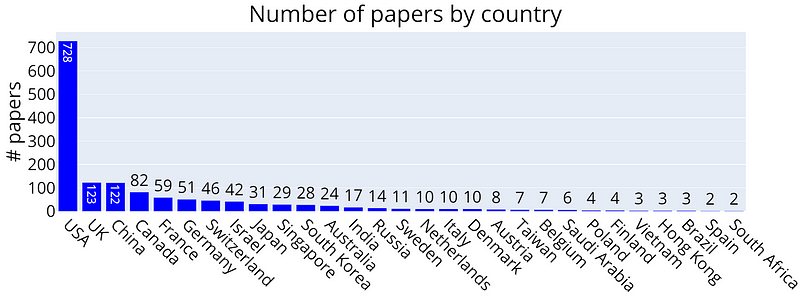
Wow! The USA participated in 728 accepted papers, approximately 3/4 of all papers. A huge lead compared to other countries.
Here is another warning: the country is attributed based on the organization’s headquarter, not on the author’s location. So if an author works at Google Zurich, the paper will be counted to the USA, and not to Switzerland.
However, despite the warning above, the numbers are not too far from reality. If we just consider universities, i.e. organizations that have only a single presence in the world, the plot would look as follows:
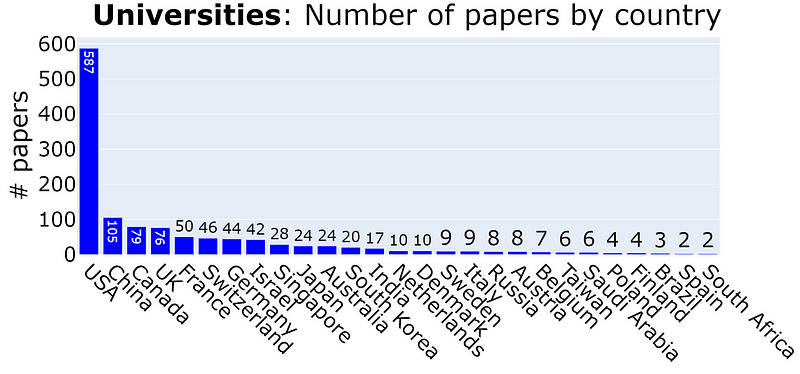
That is, even without companies, the USA still participates in publishing more than a half of the papers at ICML. If we add all the industrial researchers who work in the USA, the numbers would be close to the previous plot.
Another interesting observation is that UK and China approximately published the same number of papers. As we will see next, UK’s DeepMind approximately publishes 40% of the overall country’s record.
Let’s look at each country individually. The following are top-10 organizations (3+ papers) for top-15 countries:
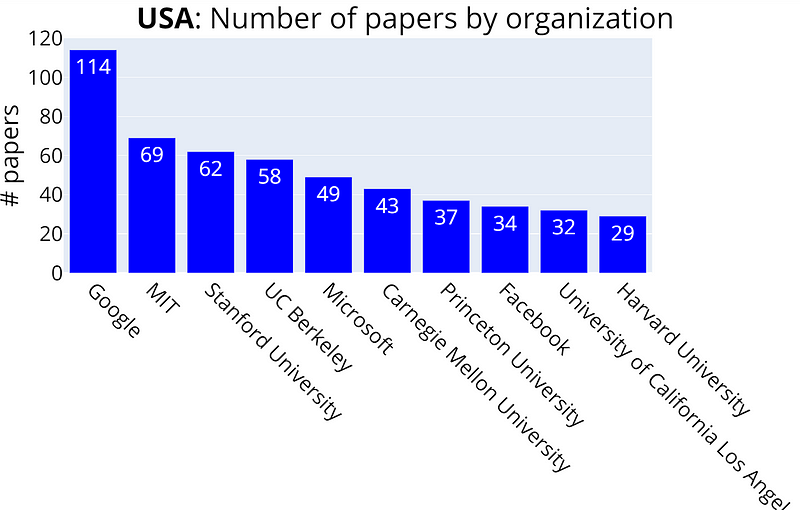
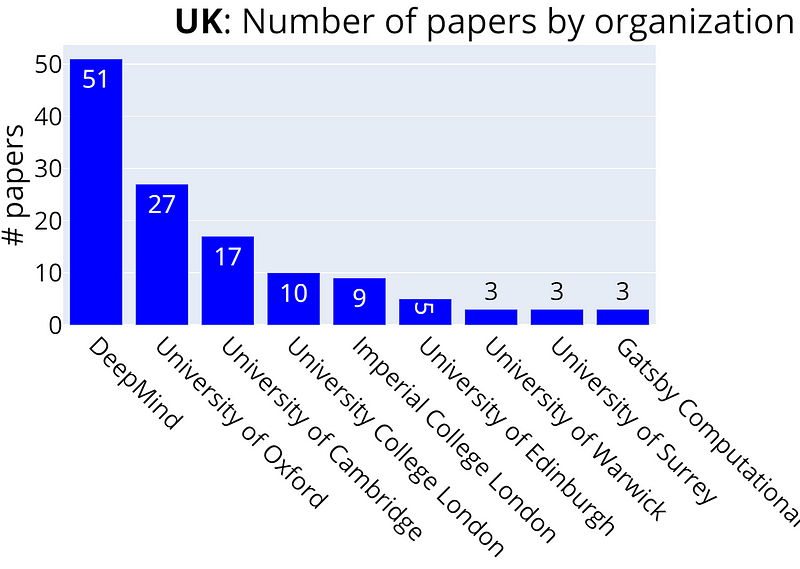
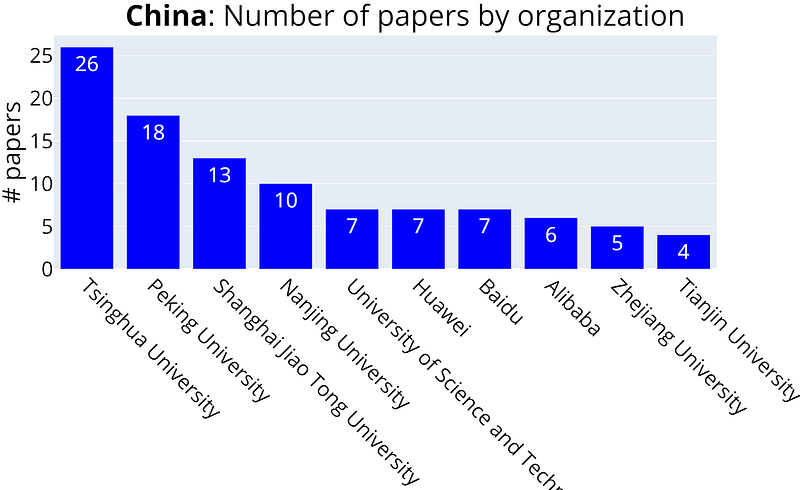
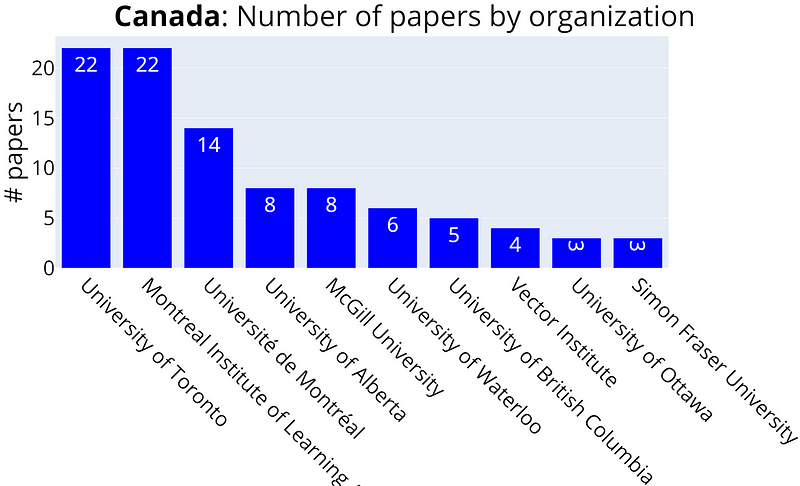
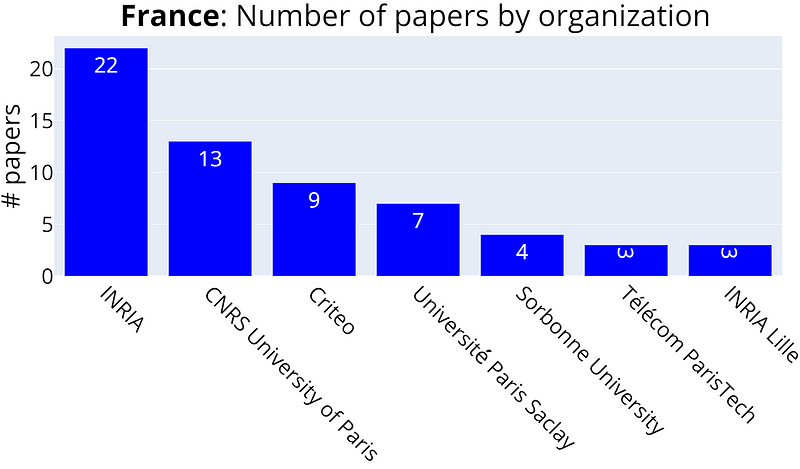
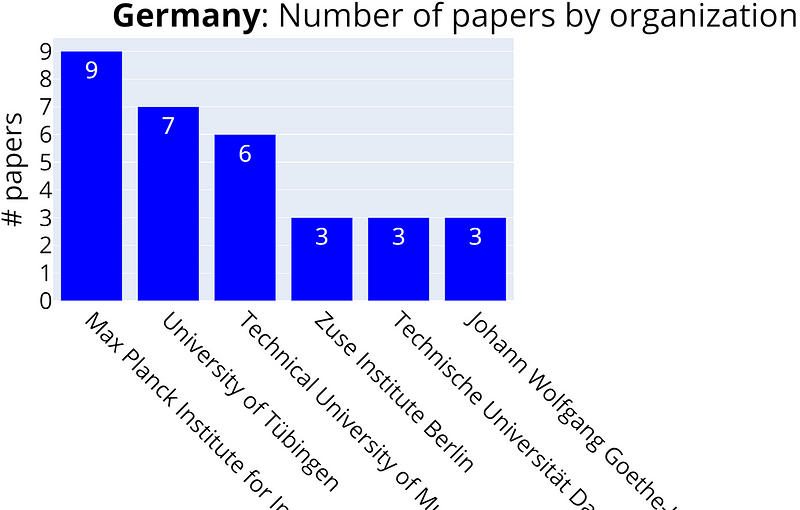
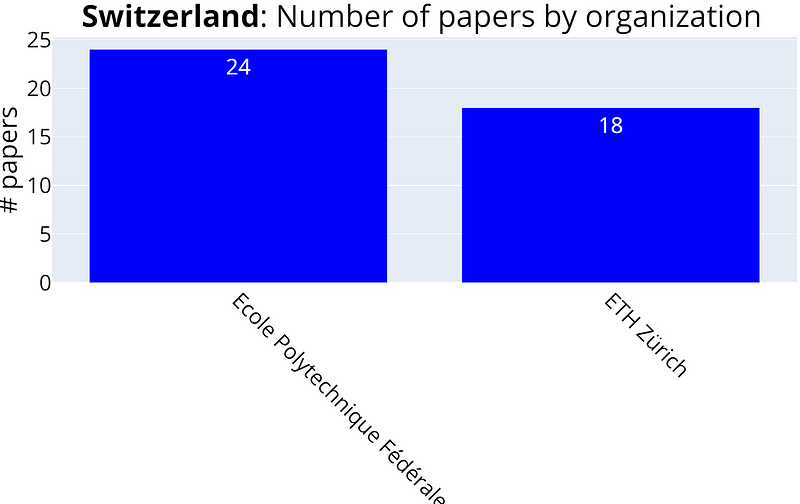
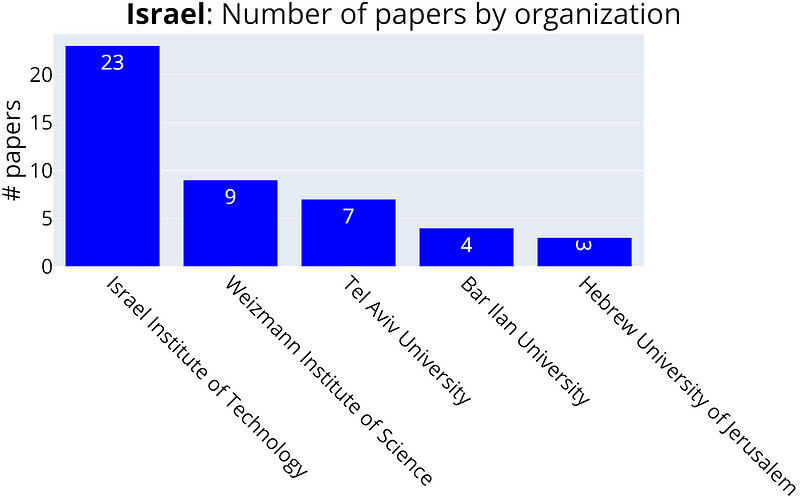
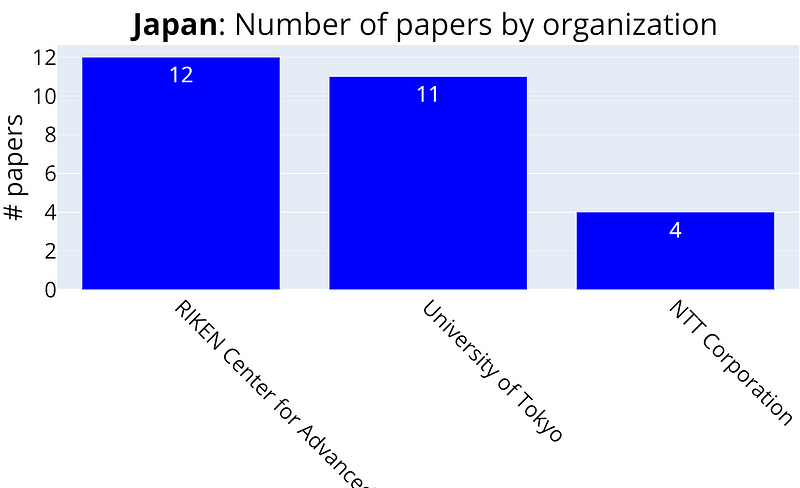
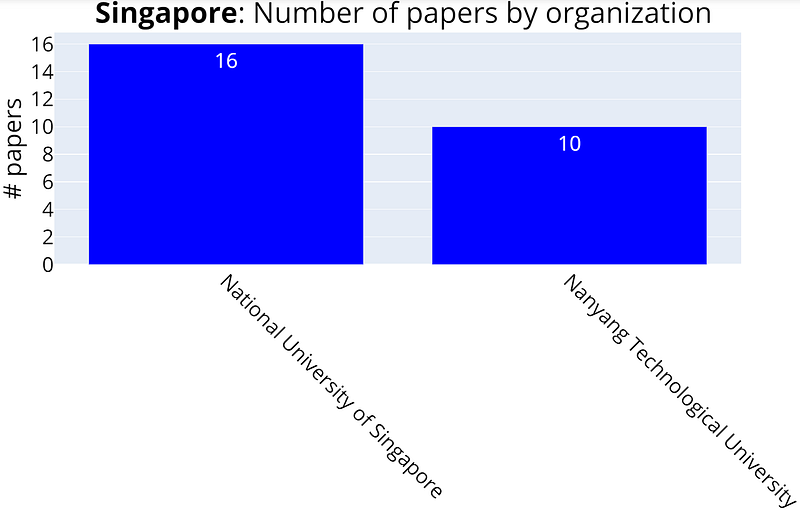
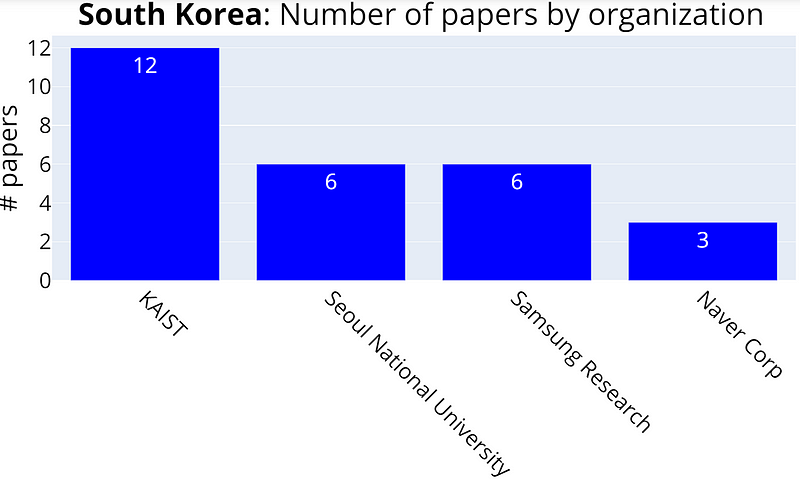
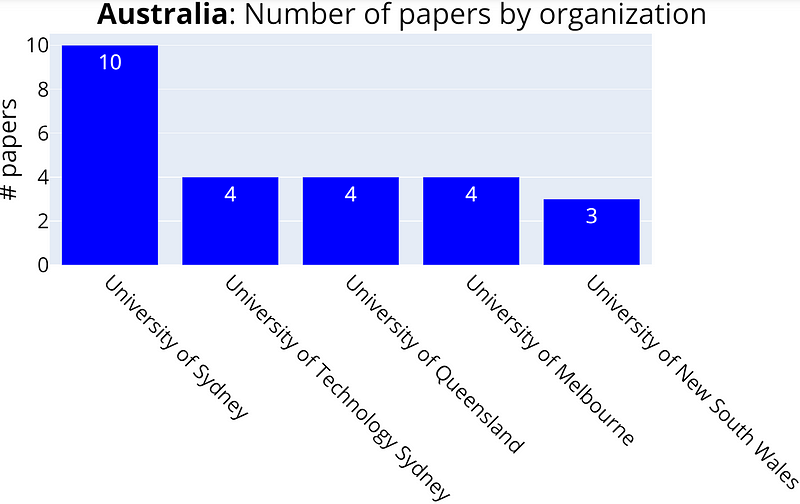
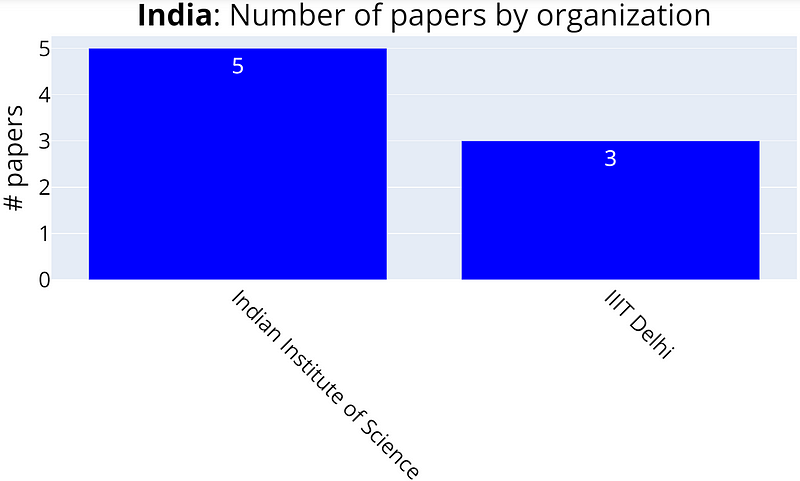
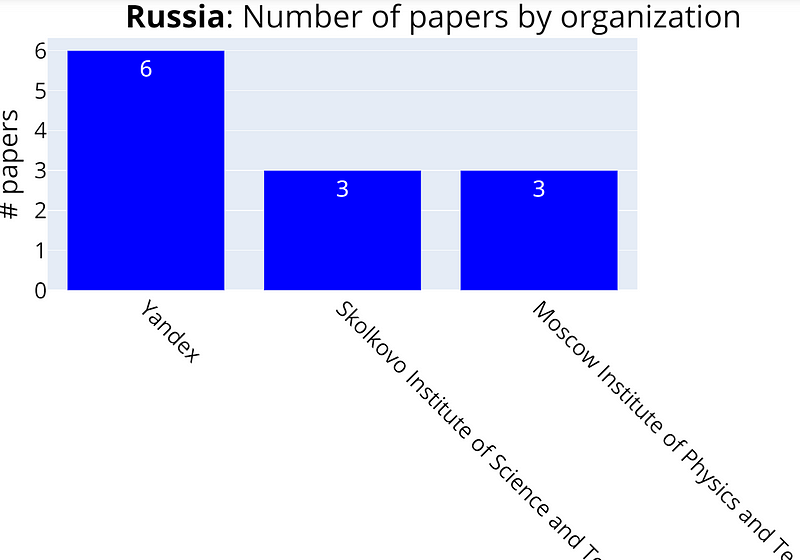
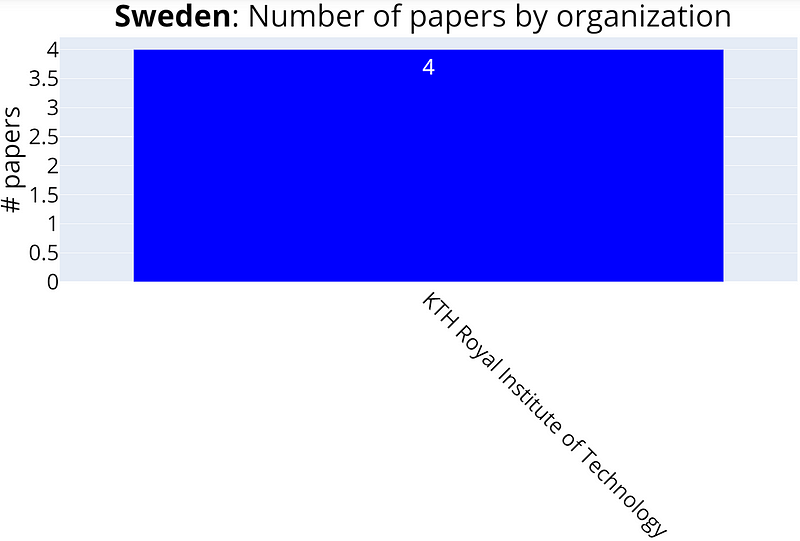
So it seems that except for the USA and China, most of the top-publishing organizations are universities. Globally, universities published 3 times more than companies.
Collaboration
We can also look at how different organizations collaborate with each other. I build a graph with collaborations between different organizations, which in total has 426 nodes and 1206 edges. If we plot it, we see a bunch of points connected by edges. You can interact with it in colab notebook.
If we just take a subgraph of nodes that have at least 30 collaborations, then we get a more appealing graph.
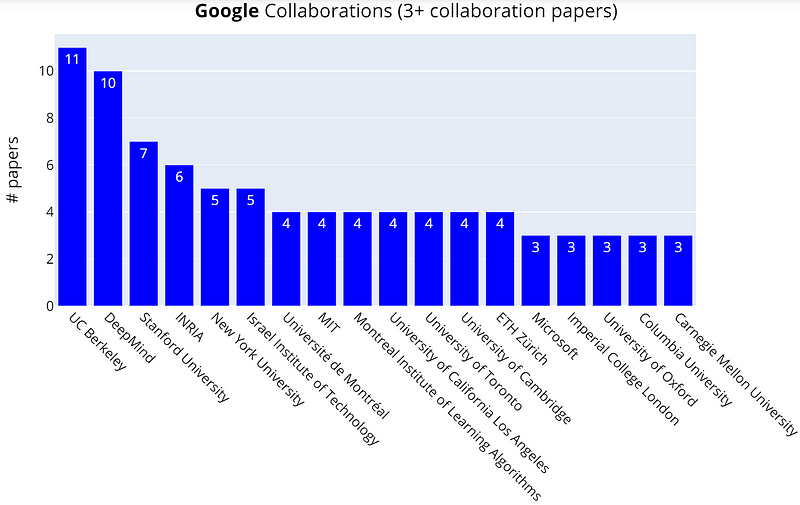
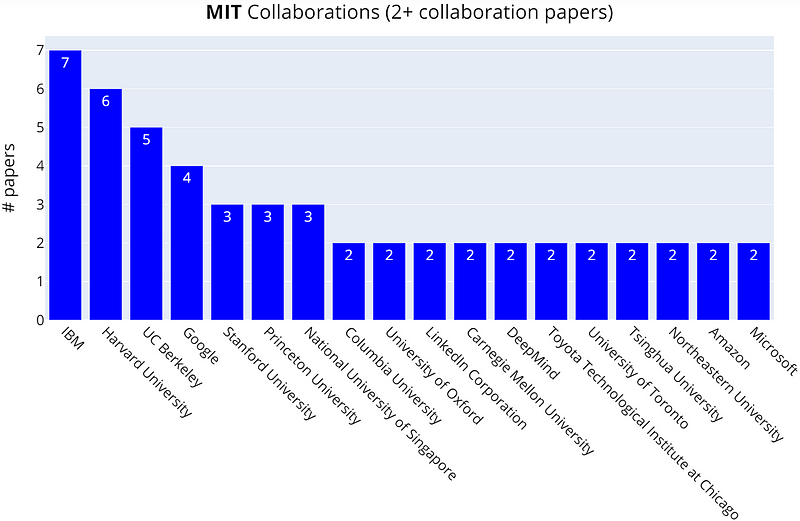
We can also take a look at individual companies. For example, for Google and MIT it looks as:
Finally, let’s look at the overall number of authors and organizations per paper.
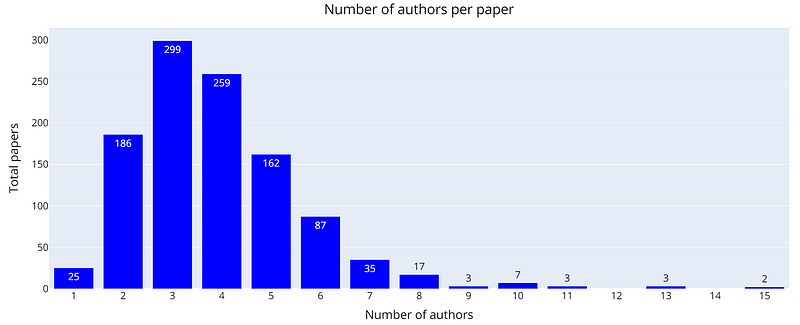
Two papers have 15 authors overall: Stochastic Flows and Geometric Optimization on the Orthogonal Group by 15 researchers from Google, Oxford and Cambridge Universities, Columbia and Berkeley Universities; and Dynamic Knapsack Optimization Towards Efficient Multi-Channel Sequential Advertising by 15 researchers from Tianjin University, Alibaba, Tsinghua University, and Shanghai Jiao Tong University.
And if we look at the number of different organizations per paper, then it’s as follows:
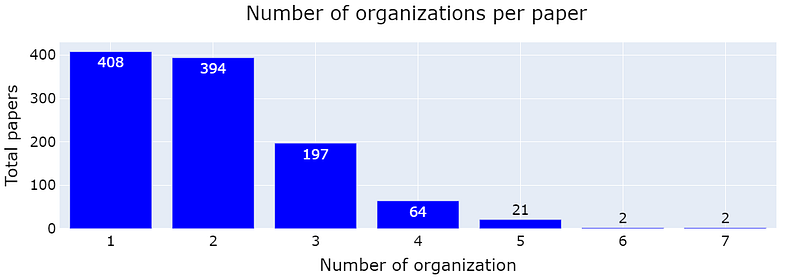
Two papers have authors from 7 different organizations: How Good is the Bayes Posterior in Deep Neural Networks Really? a collaboration between Google, Microsoft, University of Warsaw, University of Amsterdam, UC Irvine, ETH Zurich, and Imperial College London. And, Learning to Navigate in Synthetically Accessible Chemical Space Using Reinforcement Learning a collaboration between 99andBeyond, University of Montreal, IIIT Hyderabad, MIT, Mila, University of Delaware, and LinkedIn.
I will stop here, I think now we understand much more about what authors, organizations, and countries publish the most, but I bet you may have even more ideas and questions, so feel free to play with the code on GitHub and Colab notebook.
P.S. If you like this story, consider following me on medium or subscribe to my telegram channel or my twitter.
Don’t forget to check out our latest publications on medium:
Interested in joining our journey? Head over to our career page:


