
Technical Data Roadmap: Why and how to build it using a maturity matrix?
A technical roadmap is a plan of short-term and long-term goals to support a technical vision. It can be organized in a variety of ways, but it usually takes the form of a document to share this vision, the steps to reach it, and a lot of follow-up pages.

The Criteo Core Data & Governance group is in charge of a set of tools, pipelines, data, and processes to operate, improve, and monitor the Data Platform. We decided to materialize our roadmap into a maturity matrix, a format that allows us to easily assess the progress on different axes and identify areas that need more attention.
We started with these three objectives in mind:
- Define concrete steps to push our data platform to the next level
- Build a common framework and use it as a reference document for follow-up
- Synthesize knowledge on data governance to share it with the other data teams within the company
And we did it!
Here are some tips and examples to build your own maturity matrix, and you will see, the technical roadmap will automatically come out.
What does the matrix look like?
We created a matrix with 6 axes and 5 levels
The axes
First, let’s define the axes. Each of them includes services or topics we need to provide on the data platform, grouped together to make coherent and comprehensible categories.
Here are the 6 axes we defined, followed by the definition and the vision for each category.
- Platform: Keep the platform healthy and rationalize resource usage.
- Operations: Validate and measure the impacts of any operations on data.
- Documentation and Discovery: Provide a clear and comprehensive overview of all data, accessible by all data users.
- Monitoring: Monitor every aspect of the platform along with a contract (ie Operational Level Agreements (OLA), to explicitly states, towards other teams, the roles, responsibilities, policies in case of alerts or incidents). Detect and fix incidents proactively.
- Lineage and Ownership: Provide a full view of data lineage across the platform, from extraction to business usage.
- Business value: Optimize platform and processes to fit business values and needs.
The levels
Then, we defined levels on a scale of 1 to 5, 1 being the initial state where you have very basic services, to 5 where everything rocks!
- Poor: The service is not provided or at minimal effort. It lacks a formalized process and a stable environment.
- Minimal: The service exists, processes exist, maybe not rigorous but repeatable and help to ensure a minimal level of service.
- Acceptable: There are sets of defined and documented standard processes and tools established, subject to some degree of improvement over time. These standard processes are in place.
- Good: The service is automated, based on the standard processes defined.
- Rocks: The service is measured and controlled, the focus is on continually improving process performance to limit human intervention.

The main body
For each axis and each level, we now have to define the criteria to reach this level.
These criteria need to be simple (everyone should be able to understand them) and realistic (within reach and relevant for your company). See these criteria as different steps to reach the vision.
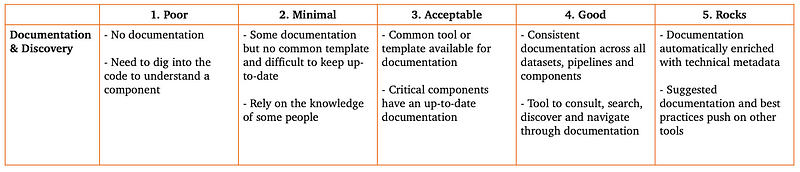
Here is a non-exhaustive example for Documentation and Discovery:
How to use it?
Defining the whole matrix is already a big step but now we have to use it to actually build the technical roadmap.
- We started by defining coherent groups of datasets or components. Most of the time the split will be by project but you may want to split projects into smaller groups with a specific use case or group two or more projects under the same perimeter.
- We scored each of our groups on the six axes.
- We defined the maximum score we want to reach. Actually, it’s not always 5. For some projects, the effort needed to reach level 5 is too high for what it will bring. The goal needs to be reachable.
- We defined the goal for the next months/quarters. When do we want to reach level 3 on “Monitoring” and level 4 on “Documentation”? → That’s our technical roadmap! It can be basic, like reach level 3 on all axes in the next six months or be detailed for each axis.
- We detailed the list of tasks or projects to launch to reach the next level, that’s our short-term goals.
The Technical Roadmap is the level of service we want to reach for each of our axes
What does it bring?
We highlighted several benefits with this matrix.
We have defined concrete steps, on all axis, to improve the Data Platform, not only for the next months but for the next years. Of course, it’s not a one-time work, it’s a document we need to update every quarter to include progress, new ideas, new constraints…
But it was also a way to share ideas and knowledge between team members, data producers and consumers, stakeholders, and top management, with:
- A definition of what a “level 5” data platform should look like
- A framework to share best practices, common concepts and processes
- A common scale to evaluate several components and datasets, acknowledging where we’re good and where we have some progress to do
I’m curious to see if it works for you, you can contact me on Twitter to share your feedback and questions!
Interested in learning more about our Data Platform? Check out these articles:
Interested in joining the journey, check out our open opportunities:


